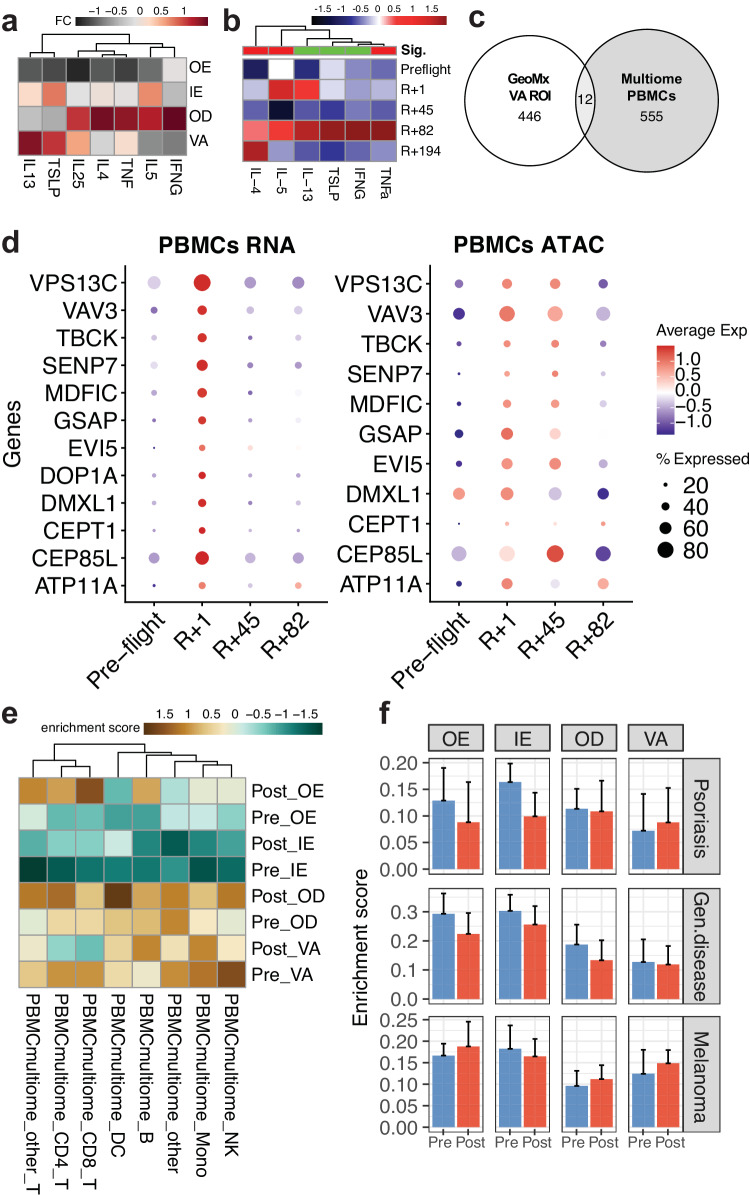
Fig. 5. Changes in the skin immune system relates to peripheral blood immune cell changes.
a Notable cytokine changes and locations from (a) skin transcriptomics data by region and, b cytokine assay from serum samples (sig. Indicates overall statistical significance of the cytokine levels in the postflight samples relative to the preflight samples, where red indicates significantly increased, and green means stable/no change; two-sided Wilcoxon test was done with the p value cutoff of 0.05), c Comparison of DEGs between PBMC multiome data and spatial transcriptomics data from VA ROIs, d Dot plots visualizing mRNA transcript expression levels (left) and gene activity score from ATAC signals (right), where preflight samples were collected 44 days before launch (L-44) and postflight samples were collected 1, 45, and 82 days post return (R + 1, R + 45, and R + 82, respectively), e Flight and cell type specific gene signature enrichment in spatial data by timepoint and ROI types, f gene signature enrichment analysis using gene signatures built from skin disease-related gene expression profiles; two-sided Wilcoxon test across four crew members and 95 ROIs was performed to obtain p value, where *p ≤ 0.05 and **p ≤ 0.01, and error bars represents standard deviation of the mean. Source data are provided as a Source Data file.

