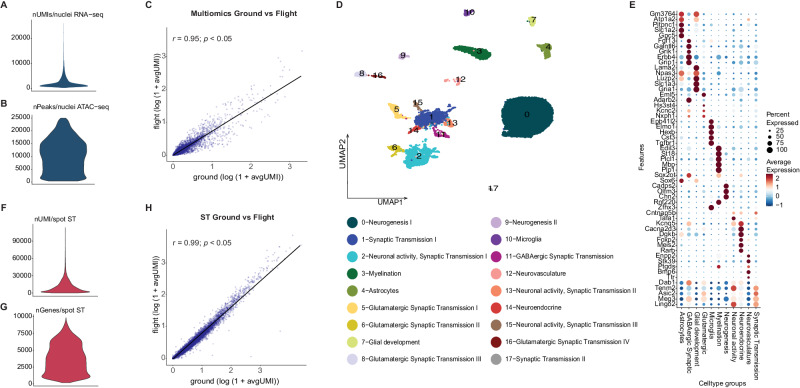
Fig. 2. Single-nucleus multiomics analysis of spaceflown mouse brains.
A Distribution of UMIs per nucleus in the entire snRNA-seq dataset. nUMI/nuclei: number of UMIs detected in each nuclei. B Distribution of peaks per nucleus in the entire snATAC-seq dataset. nPeaks/nuclei: number of peaks detected per nuclei in the multiomics dataset. C Correlation between flight (y-axis) and ground control (x-axis) single nuclei multiomics samples (Pearson’s correlation coefficient, r = 0.95; p < 0.05) shown as a scatter plot. This is a two-sided Pearson correlation test with 95% confidence intervals performed on the average expression (log(1 + avgUMI)). avgUMI: average UMI counts per spot. D UMAP of single nuclei multiomics data and cluster annotations. E 11 functional multiomics clusters categories represented by their marker genes. F Distribution of UMIs per spot for the whole spatial transcriptomics (ST) dataset. nUMI/spot: number of UMIs detected per spot in the ST dataset. G Distribution of unique genes per spot for the whole spatial transcriptomics (ST) dataset. nGenes/spot: number of genes detected per spot in the ST dataset. H Correlation between flight (y-axis) and ground control (x-axis) ST samples (Pearson’s correlation coefficient, r = 0.99; p < 0.05) shown as a scatter plot. This is a two-sided Pearson correlation test with 95% confidence intervals performed on the average expression (log(1 + avgUMI)). avgUMI: average UMI counts per spot.

