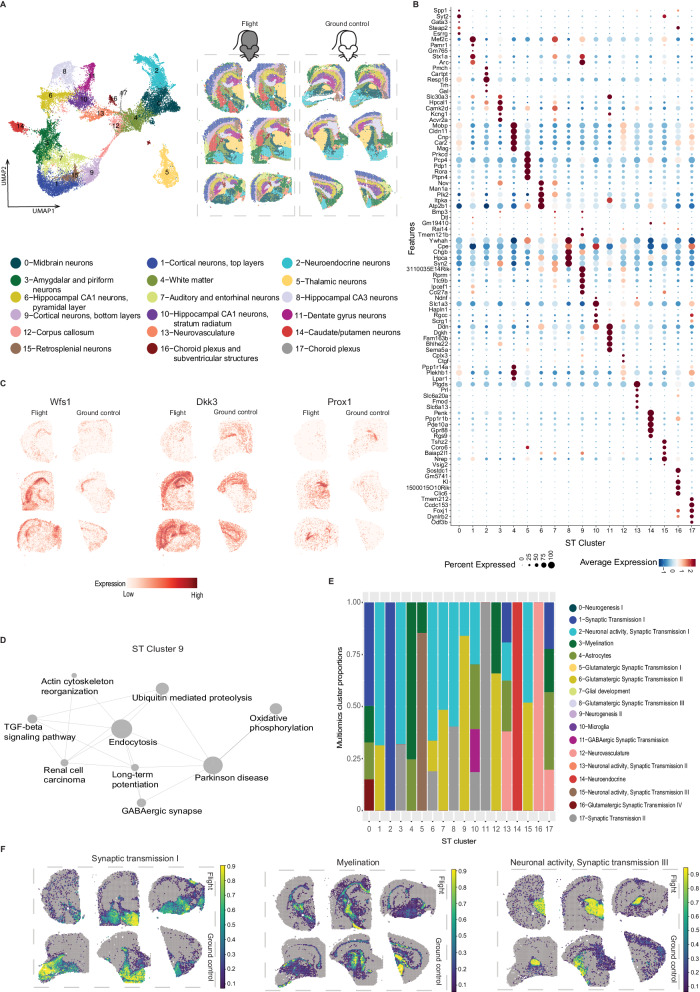
Fig. 3. Spatial Transcriptomics datasets, cell type deconvolution and pathway analysis of ST data.
A Clustering of spatial transcriptomics data, cluster annotations and spatial location of clusters visualized on flight and ground control mouse brain sections. B Marker genes for each ST cluster visualized as dotplot. C Spatial distribution of 3 genes (Wfs1 for CA1 region of hippocampus, Dkk3 for CA1 and CA3 hippocampal region and Prox1 for Dentate gyrus) in three flight (left column) and three ground control (right column) ST sections. D Significantly different pathways (p < 0.05) between flight and ground control in ST cluster 9 (Cortical neurons, bottom layers). E Visualization of number of clusters identified by single-nuclei multiomics and their proportions in each ST cluster (x-axis; 0–17). Only multiomics clusters with higher proportions (>10%) are displayed in the barplot. F Cell type proportions mapped to spatial coordinates on three ground control (top row) and three flight (bottom row) mouse brain sections (Synaptic transmission I or multiomics cluster 1; Myelination or multiomics cluster 3; Neuronal activity, Synaptic transmission III or multiomics cluster 15).

