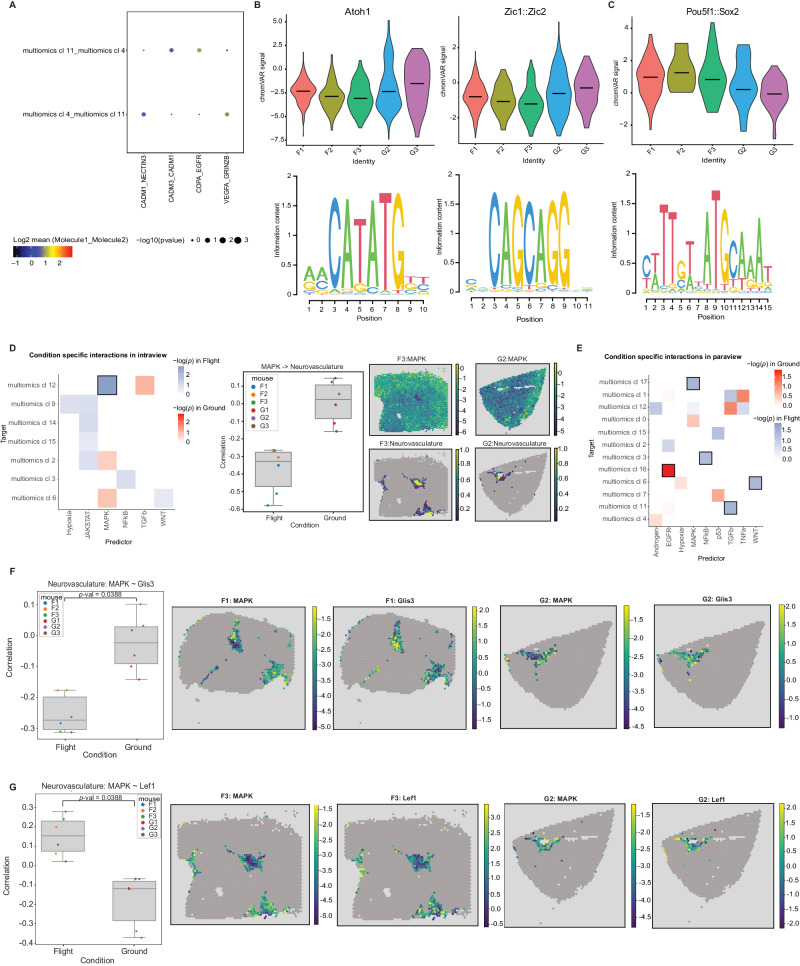
Fig. 4. Ligand-receptor interactions, motif accessibility, and signaling pathways affected by spaceflight.
A Dotplot showing the differentially expressed ligand receptor pairs found by CellPhoneDB between two interacting multiomics clusters (4 and 11) which are affected by spaceflight. These clusters showed the largest number of spaceflight DEGs, and four LR pairs were found significantly upregulated in these interactions. The null distribution of the mean expression of the LR pairs was estimated by employing a random permutation approach. The mean expression of the interacting LR molecule pairs are indicated by the dot colors and the dot sizes represent the p-values which refers to the enrichment of the LR pair in the interacting multiomics clusters. Scales for both dot size and color are presented below the plot. B Accessibility differences for motifs Atoh1, Zic1, and Zic2 in multiomics cluster 4 of flight mice and ground control mice. Spaceflight results in reduced accessibility of these motifs in flight samples. Two-sided Chi-square test statistic was used for differential testing with FDR correction (fdr <0.05). C Accessibility differences for motifs Pou5f1, and Sox2 in multiomics cluster 11 of flight and ground control mice. Spaceflight results in increased accessibility of these motifs in flight samples. Effects of spaceflight shown by increased accessibility of these motifs in flight samples. Two-sided Chi-square test statistic was used for differential testing with FDR correction (fdr <0.05). D (left) adjusted p-value of differential interactions found by MISTy in intraview (cell type and pathway activity colocalization) occuring only in flight (blue; n = 3 individual ST flight mouse samples) or in controls (red; n = 3 individual ST ground control mouse samples), tiles with black border identify statistically significant changes, (middle) correlation of MAPK pathway activity and Neurovasculature abundance, and mapped on Visium slide for two samples (right). Two-sided Student’s t tests with Benjamini–Hochberg multiple testing correction was used to determine the differential interactions. E adjusted p-value of differential interactions found by MISTy in paraview (cell type and pathway activity in local neighborhood) occuring only in flight (blue; n = 3 individual ST flight mouse samples) or in controls (red; n = 3 individual ST ground control mouse samples), tiles with black border identify statistically significant changes. Two-sided Student’s t tests with Benjamini–Hochberg multiple testing correction was used to determine the differential interactions. F Pearson correlation of Glis3 activity (left) containing vascular endothelial cells and MAPK activity (n = 6 individual ST mouse samples, 3 flight, 3 ground controls), and their respective activities in Visium slides (4 plots on the right). Two-sided Student’s t-tests with Benjamini–Hochberg multiple testing correction was used to determine the changes in correlation. G Pearson correlation of Lef1 activity (left) within spots containing vascular endothelial cells and MAPK activity, and their respective activities in Visium slides (4 plots on the right). Two-sided Student’s t tests with Benjamini–Hochberg multiple testing correction was used to determine the changes in correlation. multiomics cl: multiomics cluster. The boxplots in D, F, and G show the median as a central line, the box boundaries denote the first and third quartiles and the whiskers extend to the most extreme point in the range within 1.5 times the interquartile range from the box.

