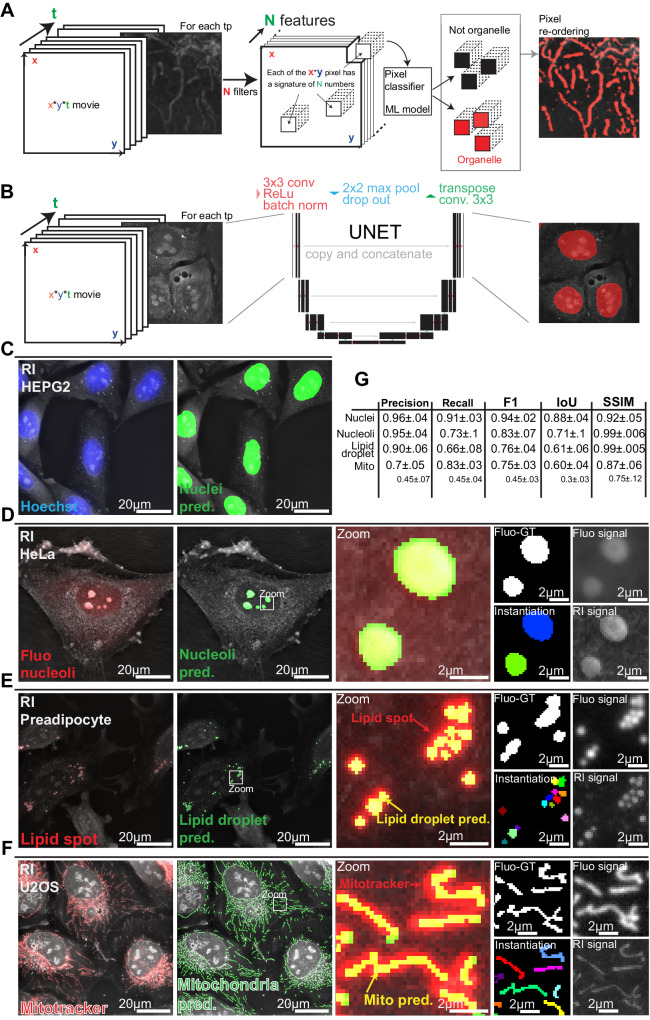
Fig. 2. Machine learning detects key organelles within HTM images.
RI-refractive index, Mito pred-mitochondria predictions. A Mitochondria and lipid droplets detection using pixel classification: a feature space of size x*y*N is calculated by applying N convolution filters on each image time point (tp) of size x*y. An extra tree classifier decides for each pixel if it belongs or not to an organelle signal based on its position in the feature space. B Nuclei, nucleoli, and cells detection using the convolutional network UNET. C–F Comparison of C nuclei, D nucleoli, E lipid droplet, and F mitochondria detection within refractive index images with their respective fluorescent label signal made partially transparent such that underlying cellular structures are visible. Structures are thicker when visualized with epifluorescence microscopy compared to holotomography. G Precision, recall, and F1 score, as well as intersection over union (IoU) score and structural similarity index measure (SSIM) for each organelle. Nuclei and nucleoli prediction scores are calculated against fluo-derived ground truths (Fluo-GT). Lipid droplets and mitochondria are evaluated against expert-corrected or raw fluo-derived ground truth.

