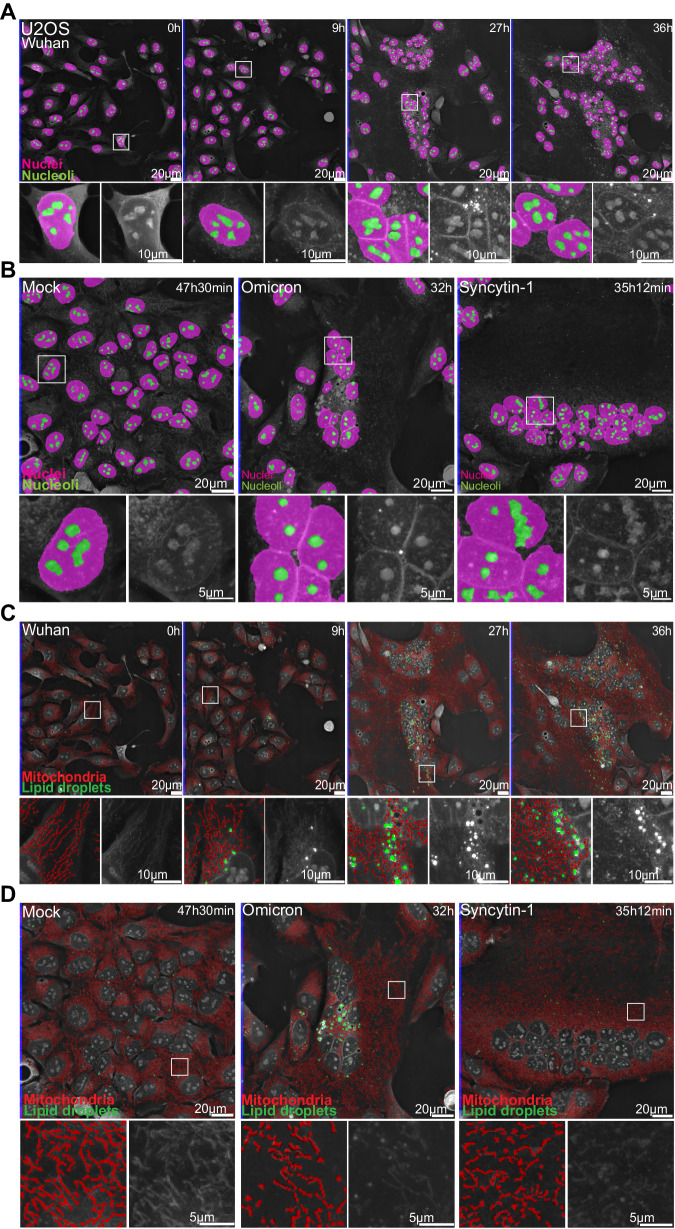
Fig. 3. Automated detections of cellular organelles capture dynamics of SARS-CoV-2-induced changes.
A 36 hours-long holotomographic microscopy (HTM) time-lapse acquisition of U2OS cells infected by the Wuhan SARS-CoV-2 strain. Pink: nuclei. Green: nucleoli. B Late time point images of time-lapse imaging experiments of non-infected cells (Mock), Omicron-infected cells, and Syncytin-1-expressing cells. Pink: nuclei. Green: nucleoli. C 36 hours-long holotomographic microscopy (HTM) time-lapse acquisition of U2OS cells infected by the Wuhan SARS-CoV-2 strain. Red: mitochondria. Green: lipid droplet. D Late time point images of time-lapse imaging experiments of non-infected (Mock), Omicron-infected, and Syncytin-1-expressing cells. Red: mitochondria, Green: LD (# of independent time-lapse acquisitions ≥ 4).

