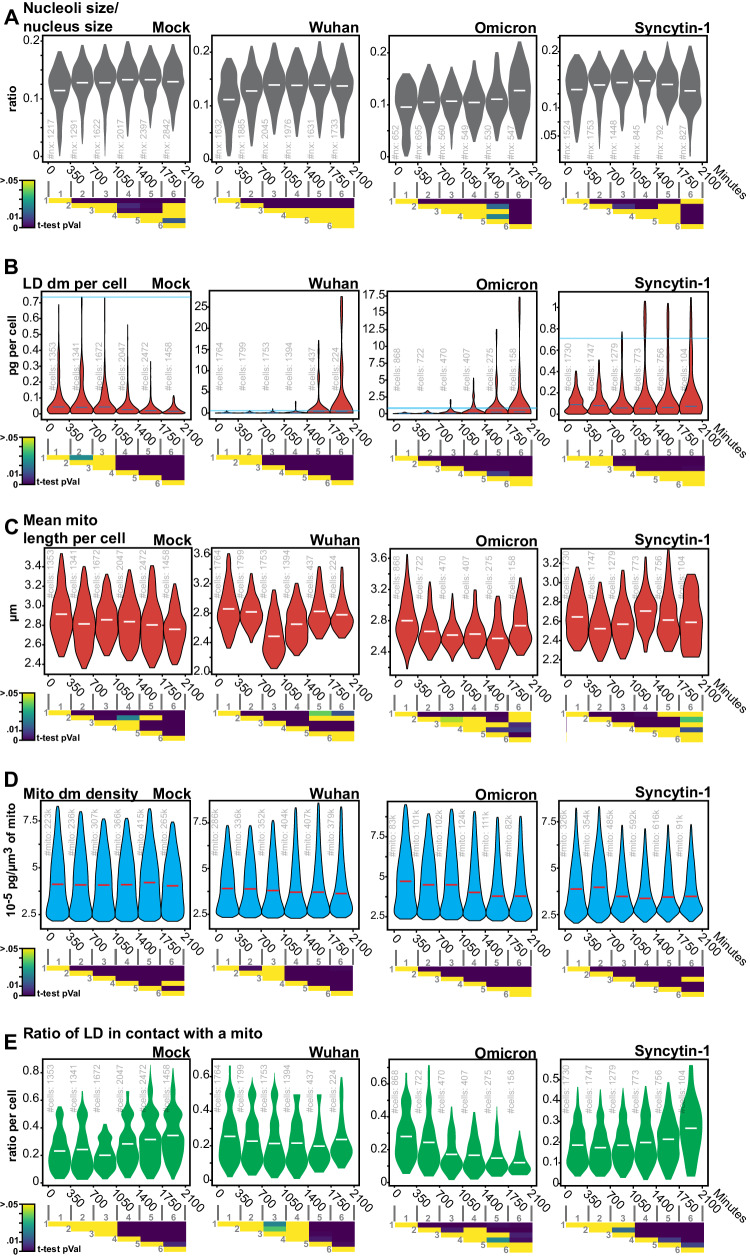
Fig. 4. Label-free quantifications of SARS-CoV-2-induced alterations of organelle dynamics.
A Nucleoli/nuclei size-ratio per cell over time (#of quantified nuclei in light-gray), B Lipid droplet dry mass per cell (#of quantified single cells in light-gray), C Mitochondria dry mass density (#of quantified mitochondria in light-gray), D Mean mitochondria length per cell (#of quantified cells in light-gray), E the ratio per cell of lipid droplets <400 nm away from the nearest mitochondria (#of quantified cells in light-gray). Violin plot representation of non-infected, Wuhan-, Omicron-infected, and Syncytin-1-expressing cells. Each violin plot represents the distribution of the segmented single cells or organelles contained within the indicated period. Bin-to-bin two-sided t-tests p-values are indicated below each experiment. Single cells and organelles studied in each of the mock, Wuhan, Omicron, and Syncytin-1 coming from at least three different movies (see Supplementary Movies 1–19).

