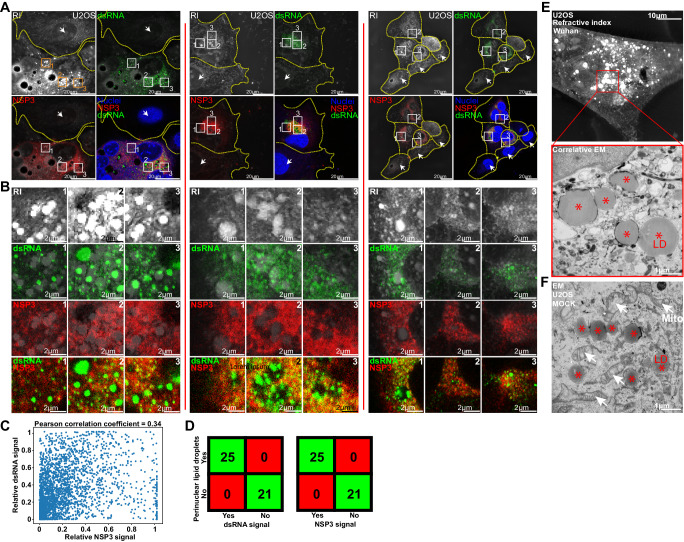
Fig. 5. Perinuclear lipid droplet accumulation is a marker of infection.
A and B Comparison of the refractive index (RI) signal acquired using holotomographic microscopy (HTM) with the double-stranded (ds) RNA and NSP3 immuno-fluorescent signals acquired with confocal microscopy. dsRNA spots are detected over and around lipid accumulations while the homogenous NSP3 signal is excluded from them (# of independent acquisitions = 8). C Scatter plot of NSP3 against dsRNA fluorescent signal and Pearson correlation coefficient of 0.34 confirm the absence of signal colocalization. D Confusion matrix. Cells with perinuclear lipid droplet accumulation have SARS-CoV-2-induced dsRNA and NSP3 signals. Cells with no LD (arrow) show no dsRNA and NSP3 signals (see Supplementary Fig. 8). E Correlative holotomography/electron microscopy (EM) in infected cells. No mitochondria surround infection-induced lipid droplets (# of independent acquisitions = 5) (see also Supplementary Fig. 4). F Electron microscopy in non-infected cells, where LD is close to mitochondria (red stars: LD white arrows: mitochondria, # of independent acquisitions = 3).

