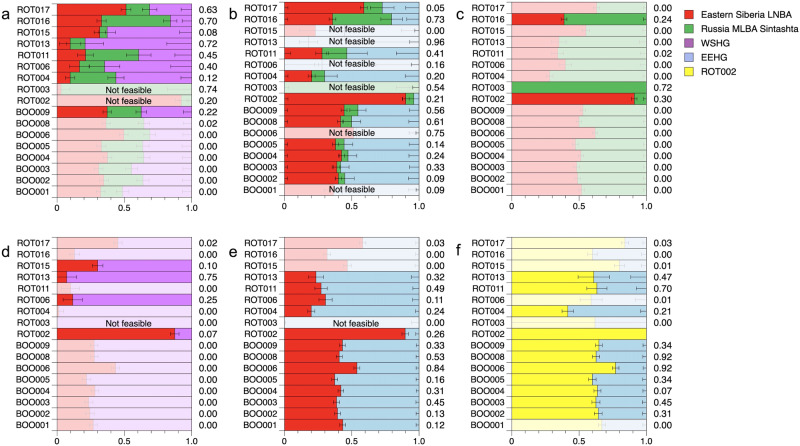
Fig. 4. Ancestry modeling for ROT and BOO individuals with qpAdm.
a qpAdm models using Eastern Siberia LNBA, Russia MLBA Sintashta, and WSHG as sources; b Models with Eastern Siberia LNBA and Sintashta as sources; c Models with Eastern Siberia LNBA and WSHG as sources; d Models with Eastern Siberia LNBA and EEHG as sources; e Models with Eastern Siberia LNBA and EEHG; f Models with ROT002 and EEHG. Corresponding p-values for each analysis are shown to the right of each row. Models with p-values < 0.05 are grayed out, and the models with negative ancestry proportions are indicated as “Not feasible”.

