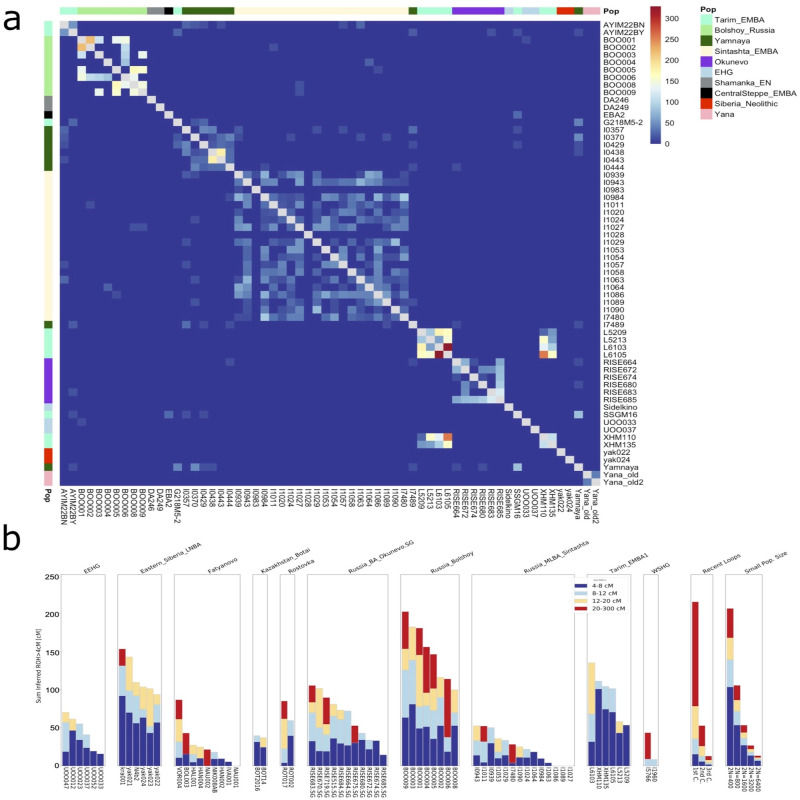
Fig. 5. Estimation of shared identity-by-descent and parental background relatedness.
a IBD sharing between BOO and published data. Shared IBD chunks between 12 and 30 cM in length are shown. The total IBD length shared is indicated by the color of the square, and population designation is shown on the y-axis. b HapROH output for BOO, ROT and relevant contemporaneous populations. Runs of homozygosity (ROH) are plotted by population for individuals with more than 400k SNPs on the 1240k panel. ROH segments are colored according to their binned lengths.

