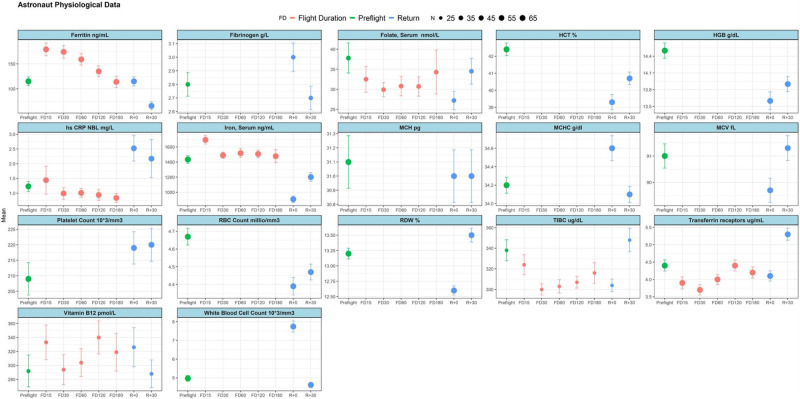
Fig. 10. Diagram showcasing a number of physiological parameters for a cohort of astronauts from across multiple missions.
The figure indicates levels of different parameters before, during and after flight and also denotes the sample size for every reading, as showcased by the included legend. The number of astronauts, n, refers to the number of astronauts for whom a particular data-point was calculated, with a standard error (SEM) indicated for every data-point accordingly. Source data for the figure is provided in the Source Data file.

