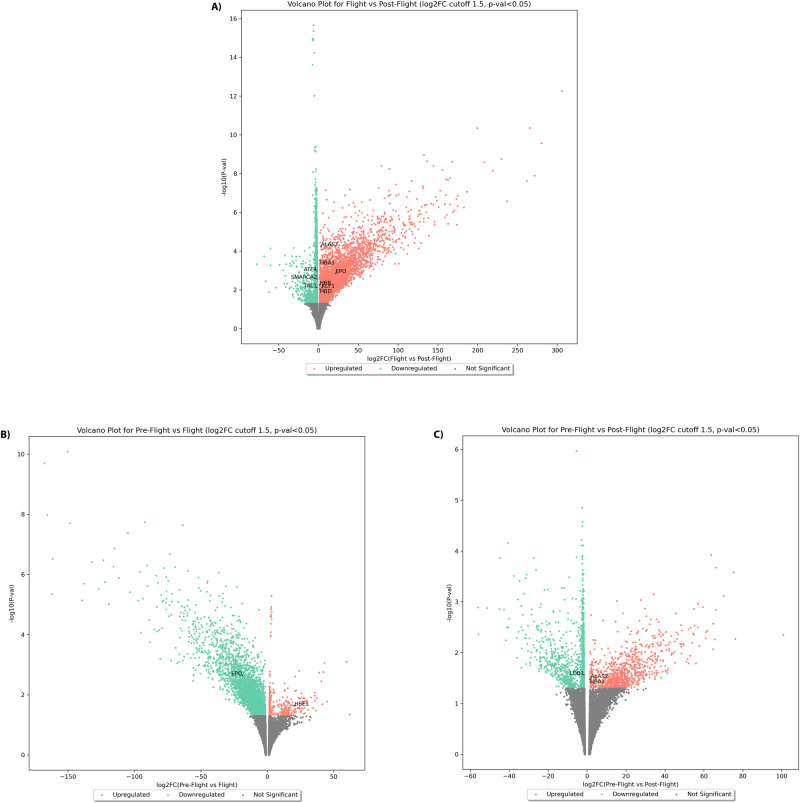
Fig. 4. Volcano plots showing significantly differentially expressed genes for the JAXA astronaut cohort.
Per-gene log2 fold-changes and respective p-values for comparisons between A flight vs. post-flight, B pre-flight vs. flight and C pre-flight vs. post-flight for the JAXA astronaut cohort are shown. Volcano plots showcase significantly up-regulated and down-regulated genes in red and green respectively, with genes of interest falling within the significantly differentially expressed gene sets indicated in the figure by gene symbol. All log2 fold-changes and p-values were calculated using DESeq2 software. Source data for the figure is provided in the Source Data file.

