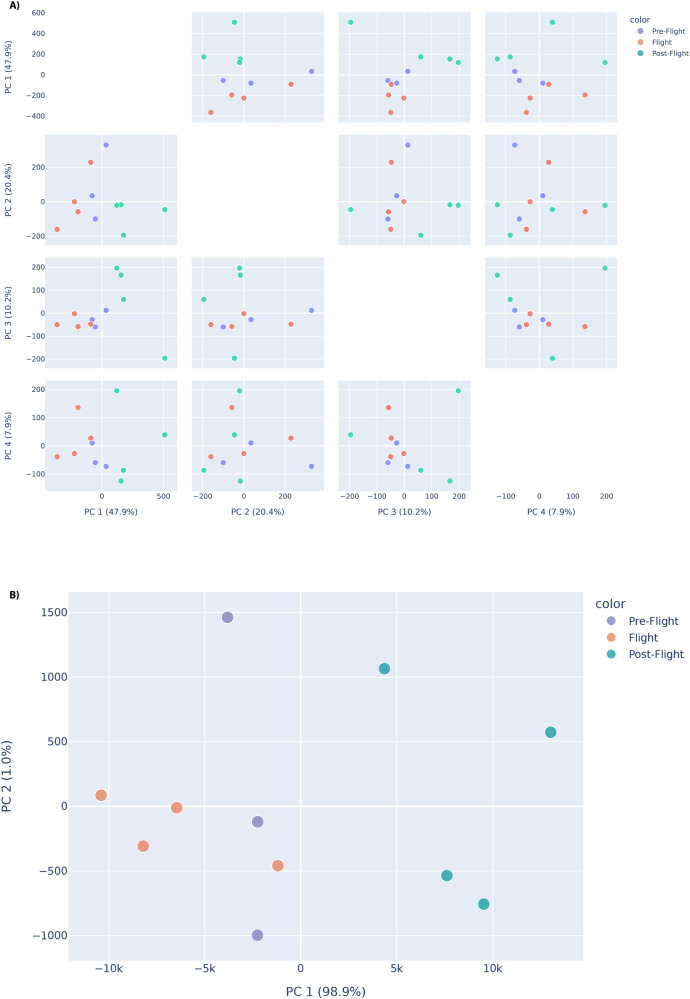
Fig. 5. PCA plots showing separation between pre-flight, in-flight and post-flight JAXA astronaut samples, based on variation in expression for genes of interest.
Separation between pre-flight, in-flight and post-flight samples is primarily visible along PC1, using A trans-acting factors and B globin genes as features for the JAXA astronaut cohort. For the trans-acting factors, four principal components are shown due to variance percentage contributions. Separation by flight status is visible in the PC1 vs PC2 plots for both globin genes (bottom) and trans-acting factors (top). Source data for the figure is provided in the Source Data file.

