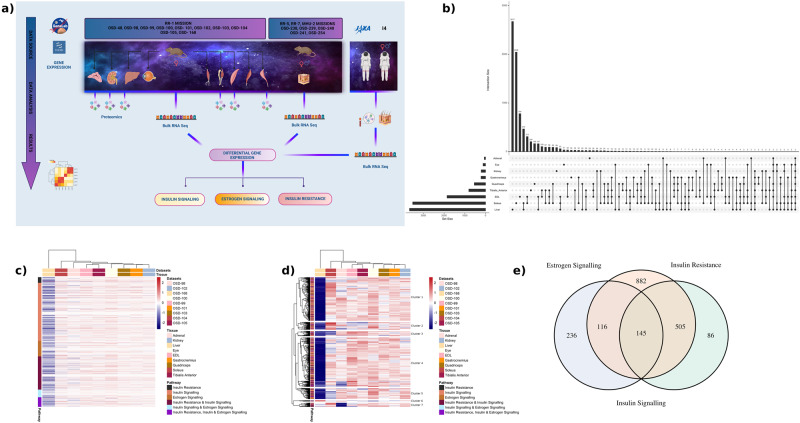
Fig. 1. Unique differentially expressed genes across tissues in mice.
a Graphical abstract showing the samples and analysis created in BioRender. b UpSet plot showing the number of differentially expressed genes (FC cutoff of 1.2 and p-adj<0.05) that are unique to each tissue and overlapping different tissues. The liver had the highest number of unique genes while adrenal had the lowest. The two genes that were common across all nine tissues were related to circadian rhythm and insulin signaling. c Global gene level heatmap of 1970 unique genes from NCBI curated gene list which are common across insulin resistance, insulin signaling and estrogen signaling pathways. Genes are the rows and columns are the nine tissues analyzed from the RR1 mission. Genes were further divided into being unique to only one of these pathways or a combination of the pathways. Heatmap shows the z-scores of logFC values from the nine tissues and the tissues are clustered using hierarchical clustering. Liver was the most affected with genes being downregulated across all pathways when comparing flight vs pre-flight. d Heatmap of 645 unique genes from NCBI curated gene list which have log fold change values across all 9 tissues. Hierarchical clustering of genes shows clusters being related to GO biological processes relevant to insulin resistance, insulin signaling and estrogen signaling (Fig. S1). e Venn diagram of insulin resistance, insulin signaling and estrogen signaling pathways with their corresponding unique and overlapping genes from the NCBI curated gene list. There are a total of 145 genes that are common across all three pathways.

