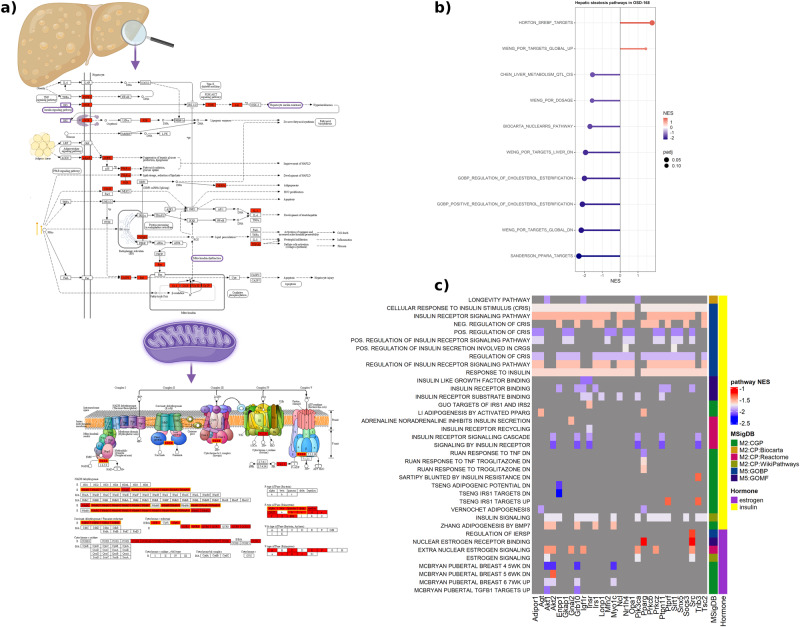
Fig. 4. Hepatic steatosis in mice liver.
a The hepatic steatosis canonical pathway with the significantly regulated genes for liver tissue from mice flown to space compared to ground control mice. The lower panel is the mitochondrial complexes and the significantly regulated genes involved visualized by ShinyGo v0.76.3 and KEGG pathway diagrams. The boxes highlighted in yellow indicate genes related to estrogen receptor signaling. Panel was created in BioRender. b Lollipop plot illustrating the normalized enrichment scores (NES) of hepatic steatosis pathways in OSD-168 (liver tissue). Only pathways with a NES obtained at an adjusted p-value <0.3 (padj < 0.3) are shown. c An illustration of common leading-edge genes across pathways of insulin and estrogen in a heatmap of the normalized enrichment scores (NES) of the pathways impacted by spaceflight in OSD-168 (liver tissue). Only pathways with NES at padj < 0.3 are shown, and only genes that are among leading edge genes seven (7) or more of the pathways are shown.

