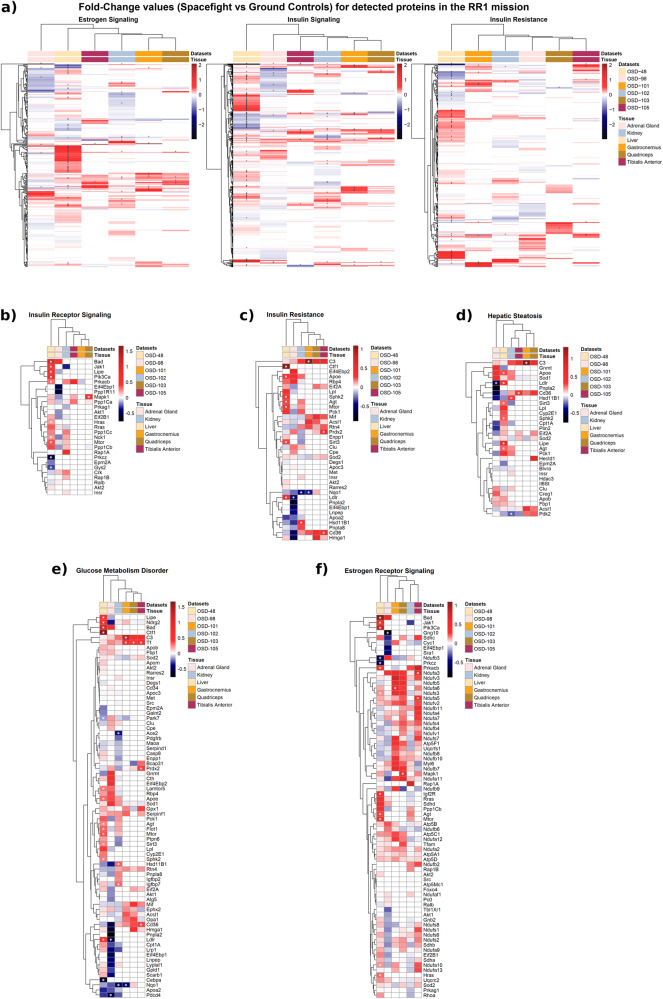
Fig. 5. Quantitative proteomics screening of different tissues from the RR1 mission samples.
a Heatmaps for logFC (Flight vs. Ground) of proteins across the estrogen signaling, insulin signaling, and insulin resistance pathways. Normalized protein intensity values were used to calculate the logFC through the Limma package. Columns represent datasets from different tissues in the RR1 missions, and rows correspond to proteins. The gray cells in the heatmap indicate missing values. Asterisks (*) overlaying cells denote statistical significance (p-value < 0.05). Liver displayed the most protein abundance changes across these pathways. Protein abundance changes for (b) insulin receptor signaling, (c) insulin resistance, (d) hepatic steatosis, (e) glucose metabolism disorders, and (f) estrogen receptor signaling, were also depicted in different heatmaps. All 0 values for b–f are for proteins which were not present in the data.

