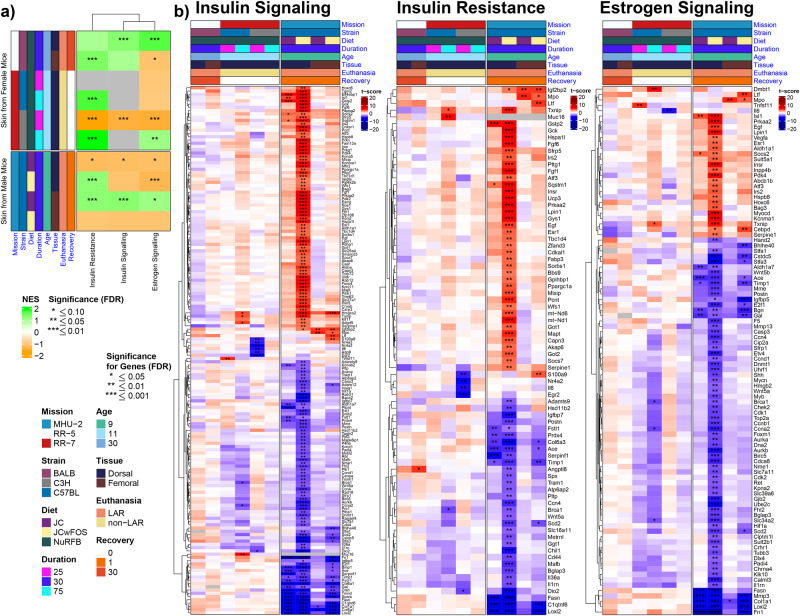
Fig. 6. Insulin and estrogen signaling, insulin resistance pathways in skin rodent samples.
a Pathway enrichment heatmap. Heatmap of normalized enrichment scores for insulin resistance, insulin signaling, and estrogen signaling pathways in spaceflight vs ground control comparisons of murine skin. Columns represent pathways, while rows represent datasets from multiple spaceflight missions, split by biological sex. Asterisks (*) overlaying cells denote statistical significance. b Gene-level heatmaps (one for each pathway). Heatmap of t-scores for highly significant (FDR ≤ 0.01) differentially expressed genes associated with the insulin and estrogen signaling as well as insulin resistance. Columns represent datasets from multiple spaceflight missions, and rows correspond to genes. Asterisks (*) overlaying cells denote statistical significance; genes must be significant in at least one of the datasets to be displayed.

