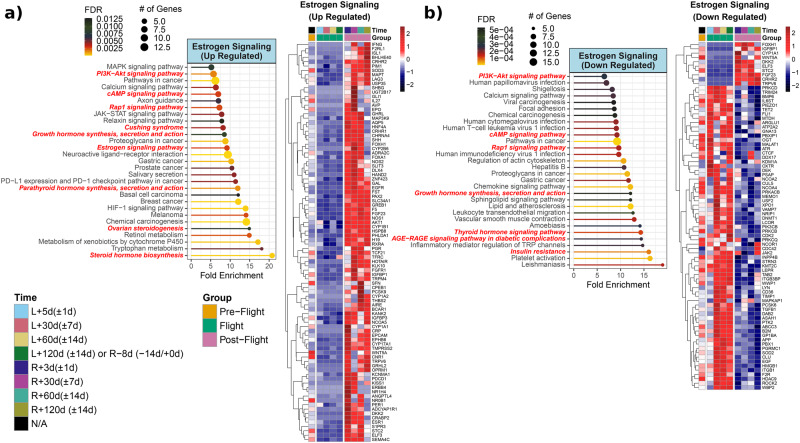
Fig. 9. Estrogen Signaling linked genes and pathways from JAXA Cell-Free Epigenome (CFE).
a Heatmap of the significantly upregulated genes compared to pre-flight for either flight or post-flight of normalized plasma cell-free RNA expression values and associated pathways for estrogen signaling over time for the six astronauts over 120 days in space from JAXA study. The values shown on are the averaged normalized expression values for all six astronauts each time point during flight and post-flight. The four pre-flight time points were averaged together, since the changes for genes in the time leading up to flight are considered to be the same and part of the baseline values. For the time, L = Launch (i.e., meaning time after launch from Earth and length in space) and R = Return to Earth. Based on heatmap, pathway analysis performed using ShinyGO to reveal the top 30 pathways (FDR < 0.05) being regulated for postflight upregulated estrogen signaling linked genes. The red bold font texts are the pathways that are directly known to regulate the insulin pathway in the pathway figure. b Heatmap and associated pathways showing estrogen signaling linked downregulated genes in postflight or flight vs preflight. Based on heatmap, pathway analysis performed using ShinyGO to reveal which pathways are being regulated for downregulated estrogen signaling linked genes. The pathways and lollipop plots demonstrate top 30 pathways (based on FDR). The red bold font texts are the pathways that are directly known to regulate the estrogen signaling pathway in the pathway figure.

