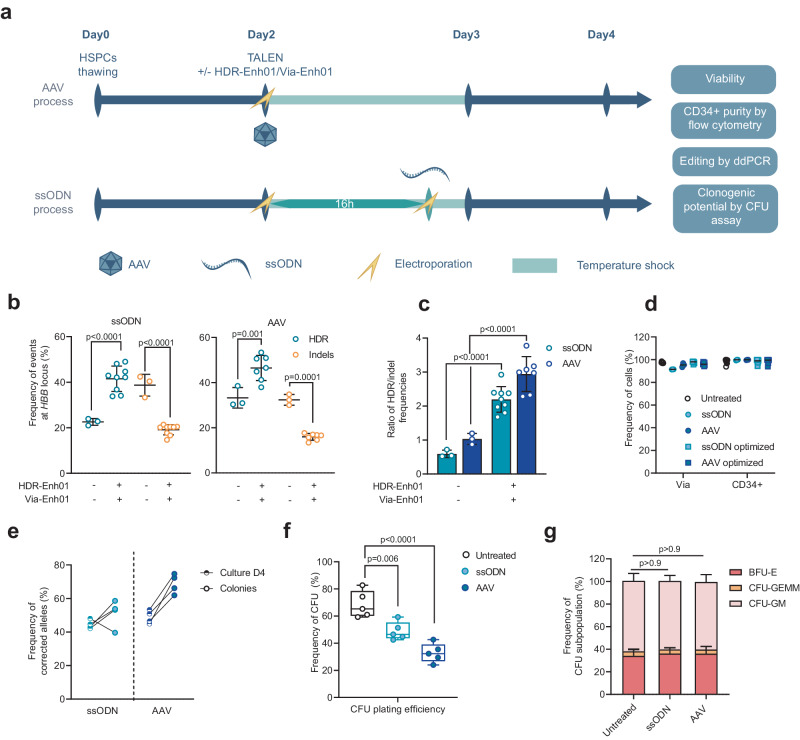
Fig. 1. Optimization of TALEN gene correction protocol at the HBB locus in HSPCs mobilized from healthy donors.
a Representative schema of viral (AAV) and non-viral (ssODN) editing protocols in HSPCs and experimental design. Frequency of homology-directed repair (HDR, blue) and insertion/deletion (indels, yellow) events (b) or HDR/Indel ratio (c) at the HBB locus measured at day 4 by ddPCR in PLX HSPCs edited with TALEN coupled with ssODN (left plot) or AAV (right plot) in the presence (+) or absence (−) of HDR-Enh01 and Via-Enh01. Data are expressed as average ± SD, for n = 3 (-), n = 9 (+, ssODN) and n = 7 ( + , AAV) biologically independent experiments and donors. A Kruskal-Wallis followed by Dunn’s multi-comparison test. P-values are indicated. d Frequency of viable cells and CD34-expressing cells evaluated at day 4 by flow cytometry in ssODN- or AAV-edited cells, subject to the optimized (dark blue) or non-optimized (light blue) protocol, compared to untreated cells for up to 9 donors. e Frequency of HDR allelic events in BFU-E colonies derived from ssODN-edited (light blue) or AAV-edited (dark blue) HSPCs compared to HSPCs from culture at day 4. Data are expressed as average frequency of corrected alleles, for cells edited by ssODN and AAV6, n = 4 biologically independent experiments and donors for each experimental group. f Box plots showing the plating efficiency, measured as the frequency of CFU colonies obtained 14 days after seeding, normalized for the number of seeded HSPCs, obtained for HSPCs edited by ssODN and AAV6 or untreated controls, n = 5 biologically independent experiments and donors for each experimental group. On each box plot, the central mark indicates the median, the bottom and top edges of the box indicate the interquartile range (IQR), and the whiskers represent the maximum and minimum data point. One-way ANOVA with Tukey’s comparison test. P-values are indicated. g Average frequency ± SD of myeloid (CFU-GM), erythroid (BFU-E), and multipotential (CFU-GEMM) colonies comparing untreated, ssODN-edited, and AAV-edited HSPCs, n = 5 biologically independent experiments and donors for each experimental group. One-way ANOVA with Tukey’s comparison test. P-values are indicated. Source data are provided as a Source data file.

