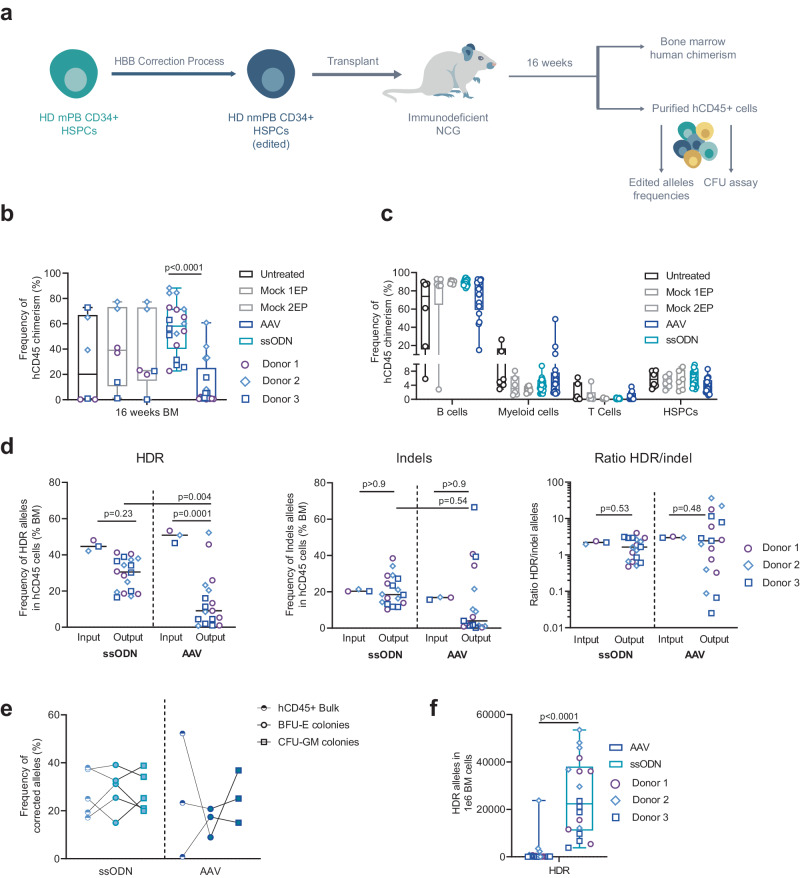
Fig. 2. Long-term engraftment and hematopoietic reconstitution of edited plerixafor-mobilized HSPCs from healthy donors in NCG mice.
a Representative schema and experimental design of xenotransplantation of HSPCs in NCG mice. b Human chimerism measured by flow cytometry at 16–18 weeks after injection. On each box plot, the central mark indicates the median value of chimerism (n = 6 mice per control group and n = 18 mice per edited group from a total of 3 HD HSPC donors), the bottom and top edges of the box indicate the interquartile range (IQR), and the whiskers represent the maximum and minimum data point. Two-way ANOVA followed by Tukey’s multi-comparison test. P-values are indicated. c Multilineage engraftment in bone marrow (BM) assessed by flow cytometry 16–18 weeks after injection. Box plots parameters are defined as in (b). d Frequency of HDR (left plot) or indels (middle plot) and ratio of HDR/indel (left plot) alleles determined in hCD45+ cells obtained from BM 16–18 weeks after injection (Output) or in HSPCs before injection (Input). Black lines represent median values (n = 18 mice per edited group from a total of 3 HD HSPCs donors). Two-way ANOVA followed by Bonferroni multi-comparison test. P-values are indicated. e Frequency of HDR allelic events in hCD45+ cells obtained from BM at 16–18 weeks after injection BFU-E and CFU-GM colonies derived from engrafted hCD45+ cells for ssODN-edited or AAV-edited groups. Data are expressed as frequency of corrected alleles, n = 5 and n = 3 biologically independent experiments and donors for cells edited by ssODN and AAV6, respectively. Black lines connect paired samples. f Number of HDR-edited alleles in 1 × 10⁶ bone marrow cells obtained in each mouse, 16–18 weeks after engraftment. On each box plot, the central mark indicates the median value of HDR or indel-edited alleles in 1 × 10⁶ BM cells (n = 18 mice per edited group from a total of 3 HD HSPC donors), the bottom and top edges of the box indicate the interquartile range (IQR), and the whiskers represent the maximum and minimum data point. Mann–Whitney two-tailed non-parametric unpaired test with a confidence interval of 95%. P-value is indicated. Source data are provided as a Source data file.

