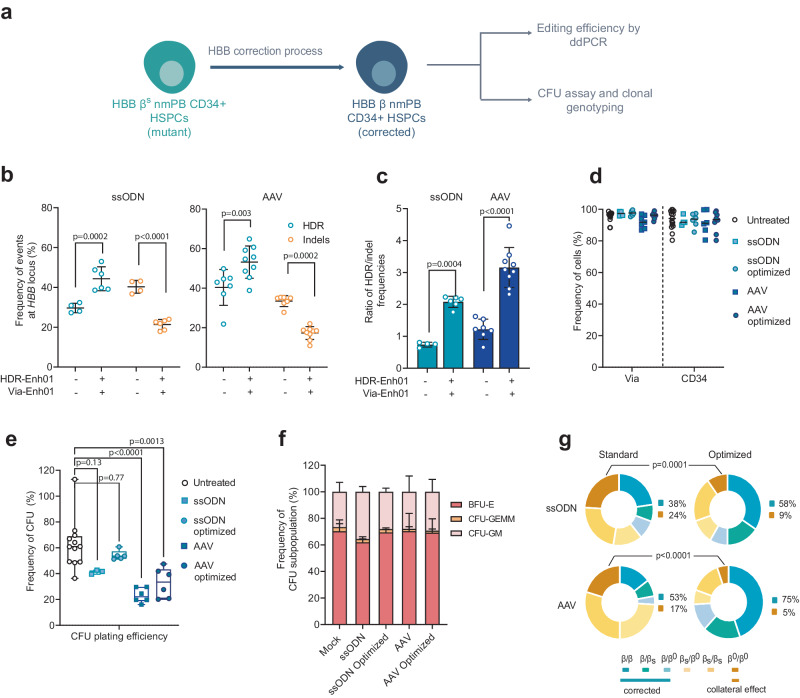
Fig. 4. TALEN gene correction protocol at the HBB locus in non-mobilized HSPCs from HbSS patients.
a Representative schema of gene correction assessment in HSPCs. Frequency of homology-directed repair (HDR) and insertion/deletion (indels) allelic events (b) or ratio HDR/indel (c) at HBB locus measured at day 4 by ddPCR in PLX HSPCs edited with TALEN and ssODN or AAV in presence (+) or absence (−) of HDR-Enh01 and Via-Enh01. Data are expressed as average ± SD for n = 4 (−, ssODN), n = 7 (−, AAV), n = 6 (+, ssODN) and n = 9 (+, AAV) biologically independent experiments and donors. Kruskal-Wallis followed by Dunn’s multi-comparison test. P-values are indicated. d Frequency of viable cells and CD34-expressing cells evaluated at day 4 in HSPCs edited by ssODN optimized (n = 6) and non-optimized (n = 4) protocols or by AAV optimized (n = 10) and non-optimized (n = 7) protocols compared to untreated cells (n = 15). e CFU plating efficiency obtained for HSPCs edited by ssODN optimized (n = 5) and non-optimized (n = 3) protocols or by AAV optimized (n = 6) and non-optimized (n = 6) protocol compared to untreated cells (n = 12). On each box plot, the central mark indicates the median plating efficiency, the bottom and top edges of the box indicate the interquartile range (IQR), and the whiskers represent the maximum and minimum data point. Each point represents one experiment performed with a given donor. One-way ANOVA with Tukey’s comparison test. P-values are indicated. f Average frequency of CFU-GM, BFU-E and CFU-GEMM colonies ± SD obtained for untreated HPSCs (n = 12) or HSPCs edited by ssODN optimized (n = 5) or non-optimized (n = 3) protocols or AAV optimized (n = 6) or non-optimized (n = 6) protocols. One-way ANOVA with Tukey’s comparison test. P-value are documented in the Source data file. g Frequency of allelic editing events detected in single BFU-E colonies enumerating bi-allelic genotype as β = corrected allele, βs = sickle allele, β0=indels allele. Data represent editing events detected in ssODN-edited groups (optimized and non-optimized protocols, n = 6 and n = 4 independent biological experiments and donors, respectively) and in AAV-edited groups (optimized and non-optimized protocols, n = 6 independent biological experiments and donors in both conditions). One-way ANOVA with Tukey’s comparison test. P-values are indicated. Source data are provided as a Source data file.

