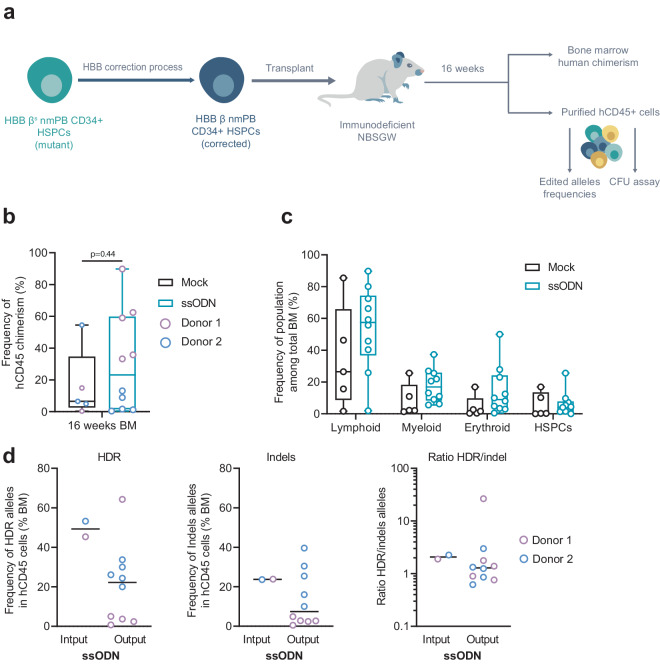
Fig. 6. Long-term engraftment and hematopoietic reconstitution of edited non-mobilized HSPCs from HbSS patients in NBSGW mice.
a Representative schema and experimental design of xenotransplantation of HSPCs in NBSGW mice. b Human chimerism assessed as hCD45+ cells in bone marrow (BM) by flow cytometry at 16–18 weeks after injection. Mock electroporated and ssODN-edited HSPCs groups are shown. Lines represent median values (n = 5 mice per control group and n = 10 mice per edited group from a total of 2 HbSS donors). Mann-Whitney two-tailed non-parametric unpaired test with a confidence interval of 95%. P-value is indicated. c Multilineage engraftment in bone marrow (BM) assessed by flow cytometry 16–18 weeks after injection to evaluate the frequency of B cells (CD19+), Myeloid cells (CD11+, CD14+, C15+), T-cells (CD3+), or HSPCs (CD34+) among the graft (hCD45+) gathered from mock and ssODN experimental groups (n = 5 mice and n = 10 mice, respectively, generated from a total of 2 HbSS donors). On each box plot illustrated in B and C, the central mark indicates the median frequency, the bottom and top edges of the box indicate the interquartile range (IQR), and the whiskers represent the maximum and minimum data point. d Frequency of HDR (left plot), Indel alleles (middle plot), and ratio HDR/indel alleles (right plot) evaluated in gDNA from hCD45+ cells obtained from BM 16–18 weeks after injection (Output) or in gDNA obtained from HSPCs before injection (Input). Black lines represent median values (n = 10 mice per edited group from a total of 2 HbSS donors). Source data are provided as a Source data file.

