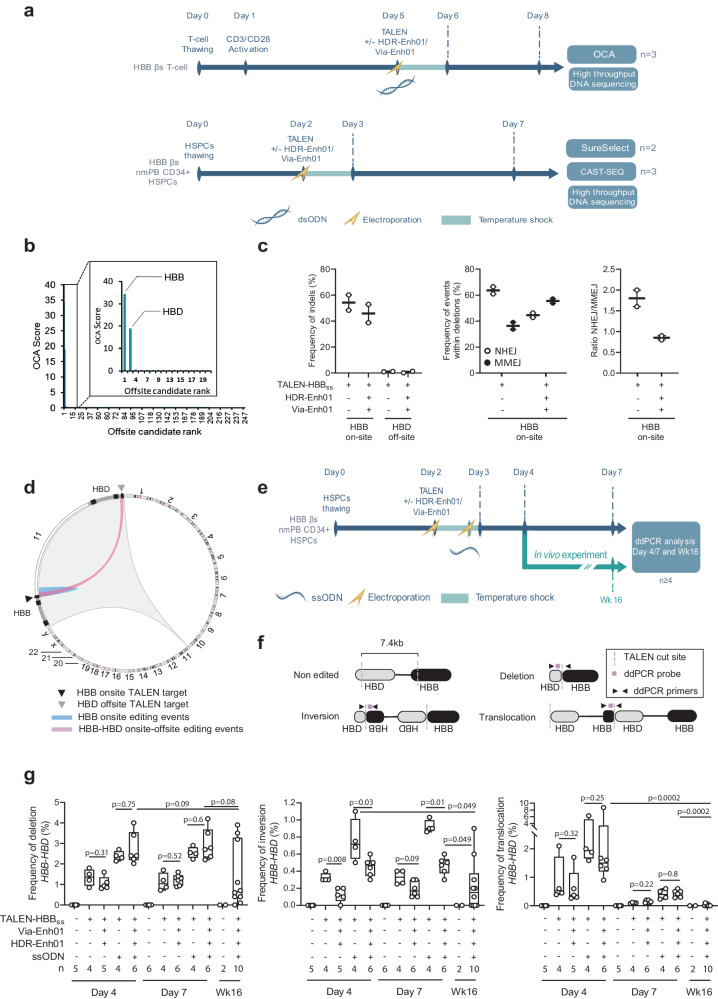
Fig. 7. TALEN off-target sites analysis and genomic rearrangements after editing at HBB locus.
a Representative schema to identify on-target and off-target TALEN-HBBss activity in HbSS patient T-cells by OCA, to quantify them in non-mobilized HSPCs from HbSS patients by SureSelect and assess their consequence on the genomic integrity of HSPCs from HbSS patients by CAST-SEQ. b Average OCA score obtained for the on-site (HBB) as well as the 247 first candidate off-sites (n = 3 independent biological experiments and donors). OCA score for the first 20 candidates showing the on-target (HBB) and the unique off-target site identified (HBD) are shown enlarged in a separate box. c Left panel, frequency of Indels obtained by high-throughput DNA sequencing of TALEN-HBBss on-target and off-target sites identified by OCA, in presence (+) or absence (−) of HDR-Enh01 and Via-Enh01. Middle and right panels, frequencies of NHEJ- and MMEJ-dependent deletions and ratio of NHEJ- over MMEJ-dependent events, respectively, detected and computed within all deletion events obtained in presence (+) or absence (−) of HDR-Enh01 and Via-Enh01. Each point represents the frequency of indels obtained in one independent experiment performed with a given HSPC donor (n = 2 independent biological experiments and donors, 5 technical replicates). d Circos plot representing the editing events occurring at HBB on site and between HBB on-site and HBD off-site, obtained by CAST-SEQ (n = 3 independent biological experiments and donors). e Representative schema of the experience performed to characterize the genomic rearrangements occurring at the HBB-HBD locus by ddPCR. f Experimental ddPCR strategy to detect deletion, inversion and translocation events at the HBB-HBD locus. g Frequencies of deletions (left panel), inversions (middle panel), translocations (right panel) at the HBB-HBD locus assessed by ddPCR. On each box plot, the central mark indicates the median value, the bottom and top edges of the box indicate the interquartile range (IQR), and the whiskers represent the maximum and minimum data point. The number of biological replicates performed with a given HbSS donor is documented at the bottom of each plot. Mann–Whitney non-parametric two-tailed unpaired test. P-value are indicated. Source data are provided as a Source data file.

