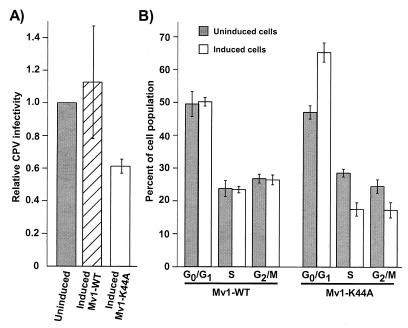
FIG. 6.
CPV infection and cell cycle analysis of uninduced and induced Mv1-WT and Mv1-K44A cells. (A) Mv1-WT and Mv1-K44A cells grown with or without tetracycline for 48 h were inoculated with CPV, and the percentage of infected cells was assayed after 16 h by anti-NS1 staining and flow cytometry. The results are expressed as the percentage of cells infected in the induced culture relative to the percentage of cells infected in uninduced cultures. The average and standard deviation of three independent experiments are shown. Each experiment had a minimum of three replicates. (B) Mv1-WT and Mv1-K44A cells grown with or without tetracycline for 48 h were analyzed for DNA content by propidium iodide staining and flow cytometry. The percentage of cells in each phase of the cell cycle was estimated with Modfit LT cell cycle analysis software. Results shown are the average and standard deviation of four independent experiments.

