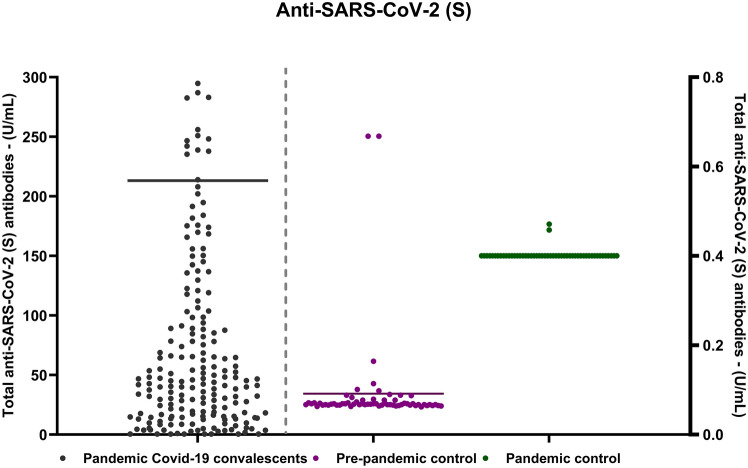
Figure 1.
The scatter plot visually illustrates all observed samples, operating two y-axes with different measurement ranges. The experimental group axis, with a peak value of 300 U/ml, encompasses serum samples from 1661 patients. The control group axis has a peak value of 0.8 U/ml, representing the “pre-pandemic control group” including serum samples from healthy donors before and during the early phases of the SARS-CoV-2 pandemic. Values below 0.8 U/ml are considered negative, while those greater than or equal to 0.8 U/ml are deemed positive.

