Figure 3.
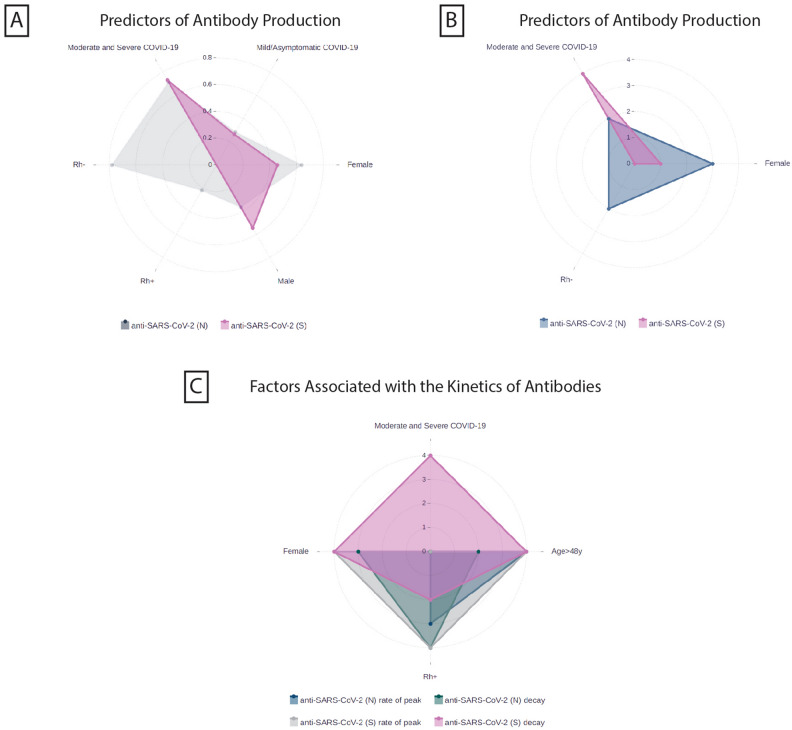
Factors associated with anti-SARS-CoV-2 antibody production and kinetics. The statistical analysis was performed by a final adjusted multivariate logistic regression model (a, b) and linear mixed models (c) and data are exhibited with odds ratios (a) and p values (b, c) on the graphs. (A)—Female gender, Rh-negative blood type, and the severity of COVID-19 infection are associated with the anti-SARS-CoV-2 (N) and (S) production. Odds ratios are demonstrated in different colored dots to show the power of association for each factor ranged from 0–0.8. (B)—On the graph b the dots are represented p values to demonstrate the probability of the mentioned factors association with antibody production. The p values are coded with the following numbers: p < 0.001 = 4, 0.001–0.002 = 3, 0.002–0.01 = 2, 0.01–0.05 = 1, > 0.05 = 0. (C)—Graph c demonstrates the factors linked with the rate of reaching antibody peak and further decay rates. The p values are coded with the following numbers: p < 0.001 = 4, 0.001–0.002 = 3, 0.002–0.01 = 2, 0.01–0.05 = 1, > 0.05 = 0.

