
Fig. 3. Spaceflight-induced changes in the kidney phosphoproteome.
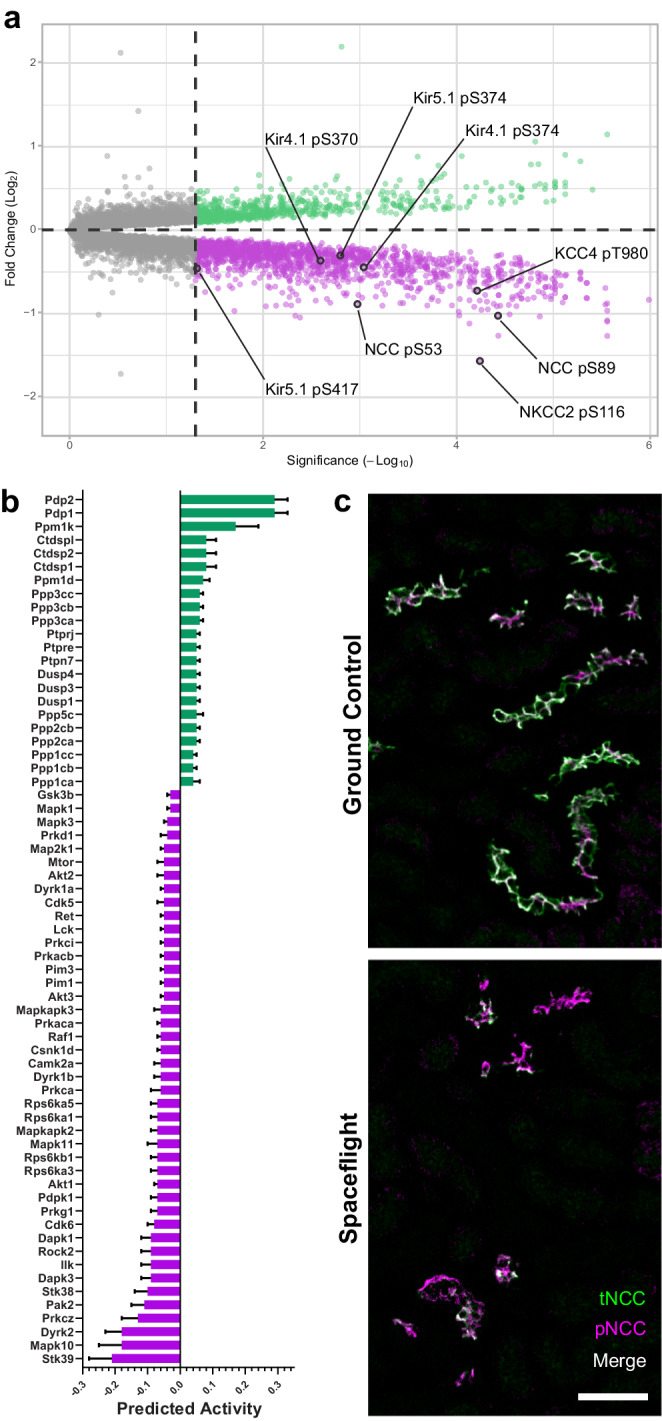
a Volcano plot of differentially phosphorylated amino acid residues detected in phosphopeptide-enriched kidney protein extract from RR-10 spaceflight-exposed mice (28 days). Regulatory phosphosites in transporters and channels related to the thick ascending limb of the loop of Henle and distal convoluted tubule are highlighted. Green indicates a statistically significant increase in peptide phosphorylation, magenta indicates a decrease, and grey represents no significant change. An unadjusted two-tailed -Log10(Adjusted P-value) of 1.3 was considered statistically significant (indicated by the dashed line intersecting the x-axis). Kir4.1 (KCNJ10); Kir5.1 (KCNJ16); NKCC2 (SLC12A1); NCC (SLC12A3); KCC4 (SLC12A7); pT, phospho-threonine; pS, phospho-serine. b Kinase-Substrate Enrichment Analysis (KSEA) was performed using the Robust Inference of Kinase Activity (RoKAI) App v2.2.1 to predict kinase and phosphatase activity levels using phosphoproteomics from RR-10 spaceflight-exposed mice (28 days) kidney tissue. Bars in blue represent downregulated activity and those in red represent upregulated activity. An adjusted P-value of < 0.05 was considered significant. Data are mean SEM. An FDR of 5% was used as a cutoff. N = 10 biologically independent animals per group (flight vs ground control). 4257 single-site phosphopeptides (Ser/Thr/Tyr) were used as initial input, 495 of which were matched to known kinase/phosphatase targets, that were then used to calculate respective predicted kinase/phosphatase activities. Input and results files for this can be found at OSD 466.c Representative confocal images of RR-10 spaceflight-exposed mice (28 days) kidney sections [n = 7 spaceflight / n = 10 ground control) stained with an anti-NCC pT44, pT48 & pT53 antibody (green; pNCC) and a total NCC antibody (magenta; tNCC) to visualise NCC phosphorylation-dependent activation (green and magenta overlap will appear as white); 50 µm scale bar.