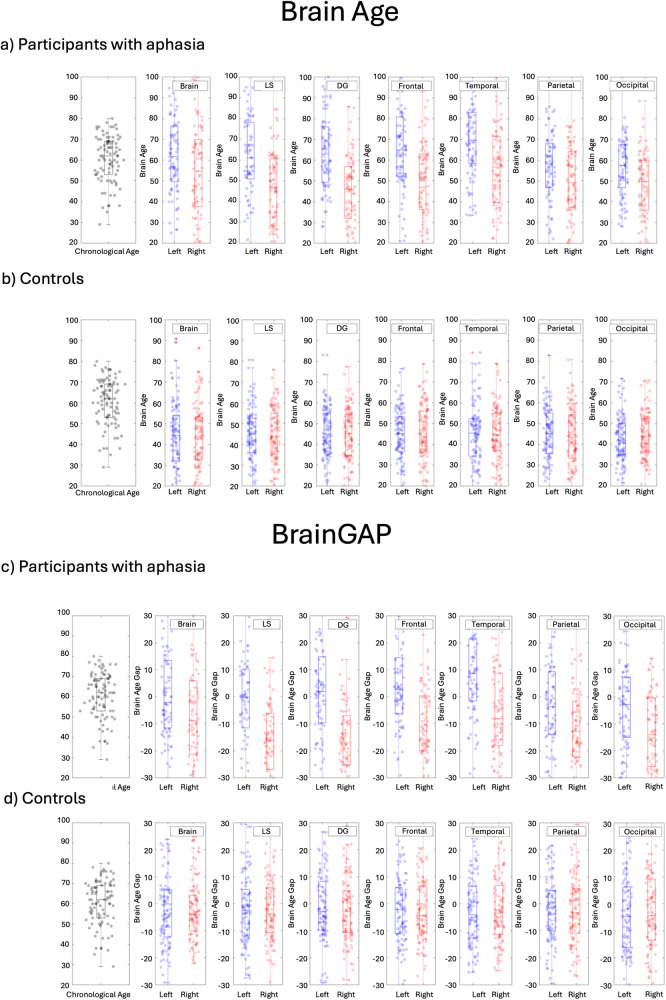
Fig. 2. Box plots showing chronological age alongside brain age and BrainGAP.
Box plots showing chronological age (black dots) then brain age (a, b) and BrainGAP (c, d) for left (blue dots) and right (red dots) hemisphere in the following brain regions: whole brain, language-specific regions, domain-general regions, frontal regions, temporal regions, parietal regions, and occipital regions. a, c show participants with aphasia, (b, d) show out-of-range controls. Note that graphs showing control participants include only out-of-range controls (i.e., control participants who had a brain age >5% higher or lower than their chronological age). LS language-specific, DG domain-general.

