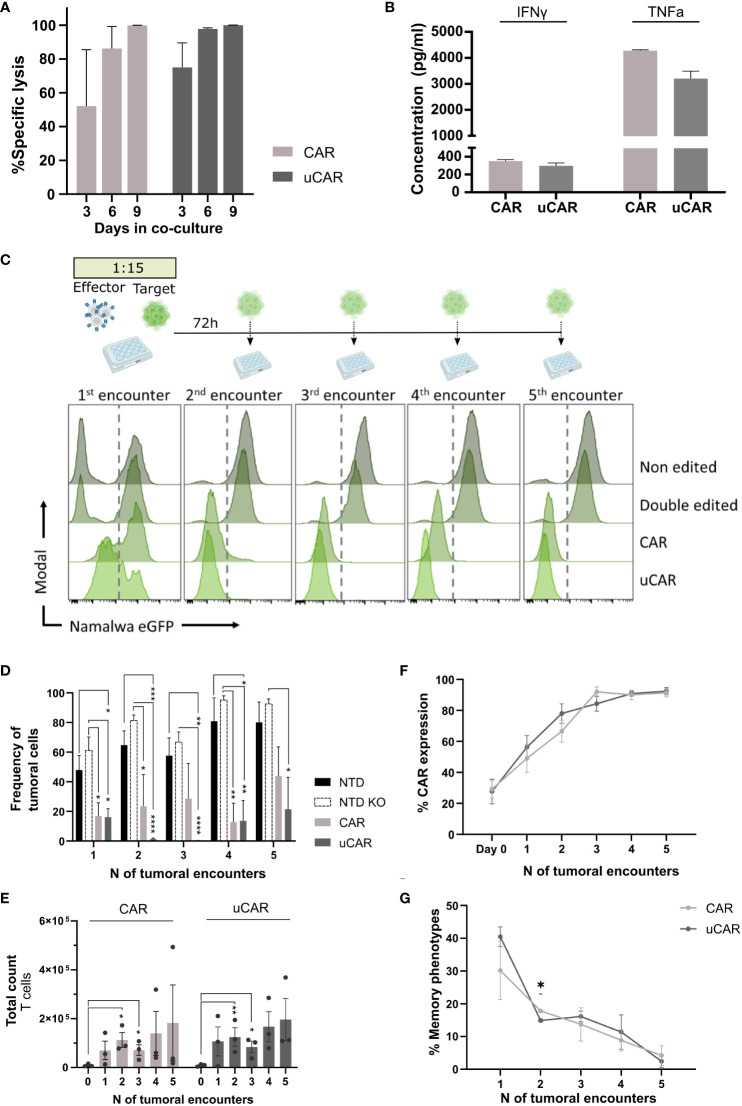
Figure 3.
Universal CAR T cells in co-culture with CD19+ tumoral cells act as non-edited CAR T cells. (A) Graph showing percentage of specific lysis of. CAR and uCAR. This parameter was calculated considering specificity when co-culturing tumoral cells with both CD19+ and CD19- cells and evaluating lysis in both cases. (B) ELISA-based quantification of IFN-γ and TNF-α secreted by effector cells after the first encounter with Namalwa cells. N=4. (C) Above.Timeline followed for cytotoxicity experiments. At day 0 tumoral cells are seeded with CAR T cells at ratio 15:1 respectively. Every 72h CAR T cells are rechallenged with tumoral cells. Below. Histograms resulting of cytometric analysis of the different co-culture wells showing presence of Namalwa CD19+ cells, tracked by FITC expression. In each histogram T cells can be tracked in the left and Namalwa in the right side (divided by a discontinuous line). (D) Graph representing frequency of tumoral cells in the different tumoral encounters. (E) T cells expansion, in terms of absolute numbers, over the tumoral rechallenges. (F) CAR expression in CAR and uCAR populations in co-culture with the tumoral cells. (G) Frequency of the sum of Tscm and Tcm after the different tumoral encounters; Friedman and Wilcoxon tests were performed. *p< 0.05, **p<0.01, ***p<0.001, ****p<0.0001. Non-significant results were not labelled in the graphs.

