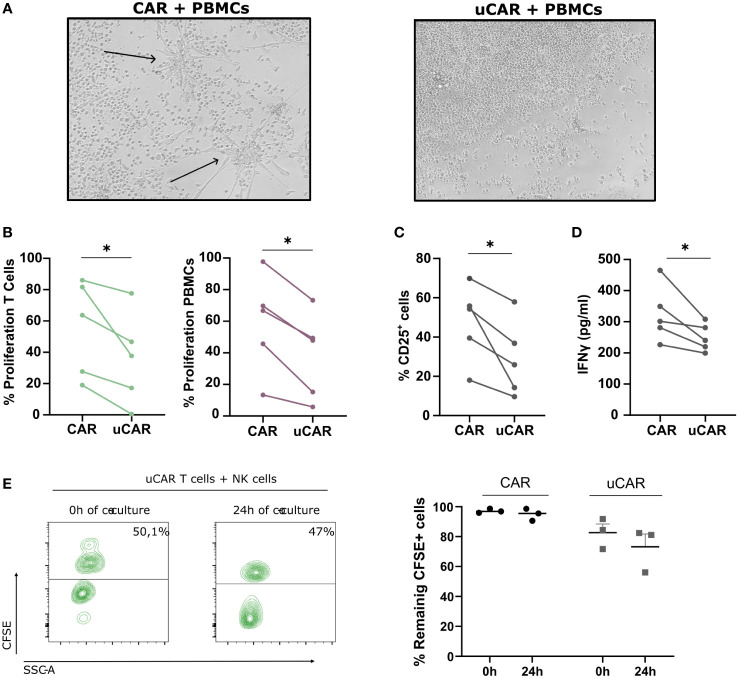
Figure 4.
Alloreactivity Analysis of Universal CAR T Cells. (A) In a well with a 6-day co-culture 1:1 (T cells-PBMCs) no visible reaction is found using an optic microscope (10X). The arrows denote the differentiation signals of PBMCs visible to the naked eye. (B) When evaluating proliferation, based on CFSE and CTV dilution, we found a more resting state in wells where T cells did not present TCR nor HLA-I. N=5. (C) We measured by cytometry expression of the activation marker CD25+ in the total population and found similar results. N=5. (D) IFNγ liberation was measured by ELISA and represented as pg/ml. N=3. (E) Proportion of T cells (CFSE+) and NK cells (CFSE-) at initial (0h) and final point (24h) (left image). We represented frequency of remaining CFSE+ cells for both CAR and uCAR products. Data represented as fold change related to each donor. Wilcoxon tests were performed. *p< 0.05. No significant results were not labelled in the graphs.

