Figure 6.
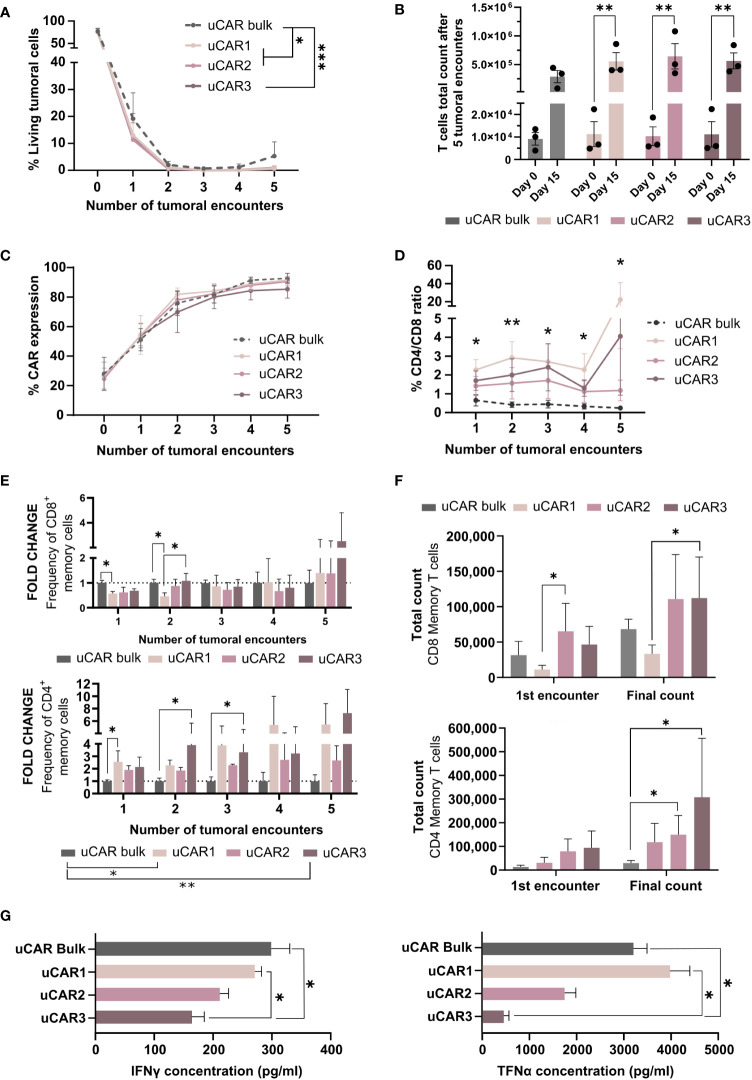
Cytolytic behavior of Memory Universal CAR T cells. (A) Graph showing frequency of living tumoral cells during several encounters, evaluated every 72h. (B) Representation of the T cells total expansion after five tumoral encounters. This data has been determined considering T cells count at each point in order to obtain the magnitude of the expansion. (C) CAR expression was measured by flow cytometry and represented as frequency in each well. (D) At each time point frequency of CD4/CD8 was evaluated by flow cytometry and represented for each set of cells as fold change related to day 0. (E) Representation of the summatory of Tscm and Tcm present in CD8+ (left) CD4+ (right) populations. Fold change related to uCAR population is represented. (F) Absolute numbers of memory T cells in each product. This data was obtained taking into account the frequency of Tscm and Tcm in each condition and T cells count in each condition. (G) IFN-γ (left) and TNF-α (right) cytokine quantification by ELISA assays, secreted by effector uCAR T cells after the first encounter with Namalwa cells. N=3; Friedman and Wilcoxon tests were performed. The legends show significance levels from ANOVA comparing group means overall. Specific significances at each time point are marked with asterisks directly on the graph. *p< 0.05, **p > 0.01, ***p > 0.001.

