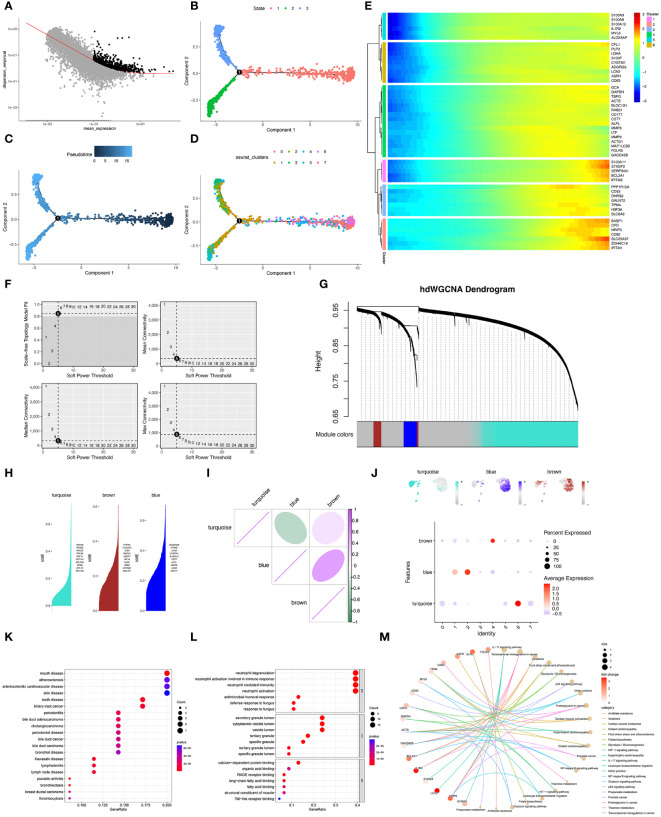
Figure 3.
Pseudotime analysis and hdWGCNA analysis of sepsis-related neutrophils. (A–D) Pseudotime analysis for Neutrophils. (E) Six clusters of neutrophils by moncyte analysis and hub genes in each cluster were visualized. (F) Top left panel depicted the soft power threshold for choosing a scale-free topology model fit greater than or equal to 0.9. The other three panels showed the mean, median, and max connectivity of the topological network respectively when different minimum soft thresholds are chosen, reflecting the connectivity of the network. The average connectivity of the topological network is most stable at the lowest soft threshold equals. (G) Three modules were identified as shown in the hdWGCNA dendrogram. (H) Hub genes in each module were identified and ranked by k-means. (I) Correlation of three gene modules (turquoise, brown, and blue). (J) Feather plots depicted the corresponding module scores in neutrophils and the bubble plot displayed the scores obtained by three modules in neutrophils subtypes. (K) Dot plot of the DO functional enrich analysis of cluster 1&2 neutrophils. (L) Dot plot of the GO functional enrich analysis of cluster 1&2 neutrophils. (M) Cnet plot of the KEGG functional enrich analysis of cluster 1&2 neutrophils.

