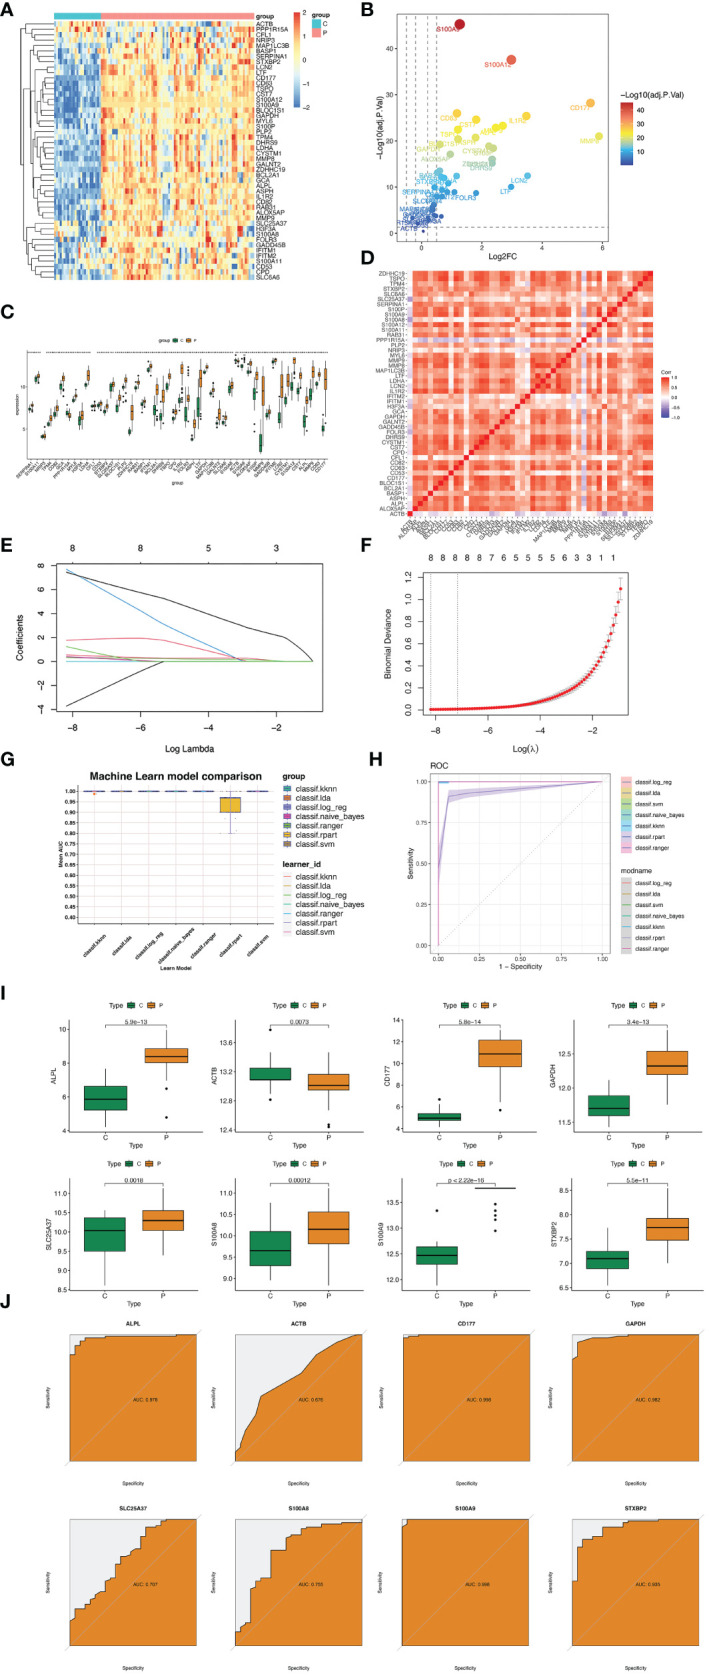
Figure 4.

Hub genes selection based on machine learning algorithms. (A) Heatmap displaying the distribution of 50 DEGs. (B) Volcano plot showing expression of DEGs (|logFC|>1 and adjusted P value<0.05) in cluster 1&2 neutrophils. (C) Box plots displaying the expression of the expression of the top 50 genes. (D) Heatmap for correlations between 50 DEGs. (E) Coefficient profile plots showing the shrinkage of gene number. (F) Penalty plot for the LASSO model. (G) The AUC of seven machine learning althogrims. (H) Mean AUC of fivefold cross-validation for 9 replications of each model. (I) Expression difference of ALPL, ACTB, CD177, GAPDH, SLC25A37, S100A8, S100A9, and STXBP2 in GSE57056 between sepsis group and control group. (J) In GSE57056, ROC curve of predicted risk scores of ALPL, ACTB, CD177, GAPDH, SLC25A37, S100A8, S100A9, and STXBP2 in sepsis diagnosis. *, P<0.05.
