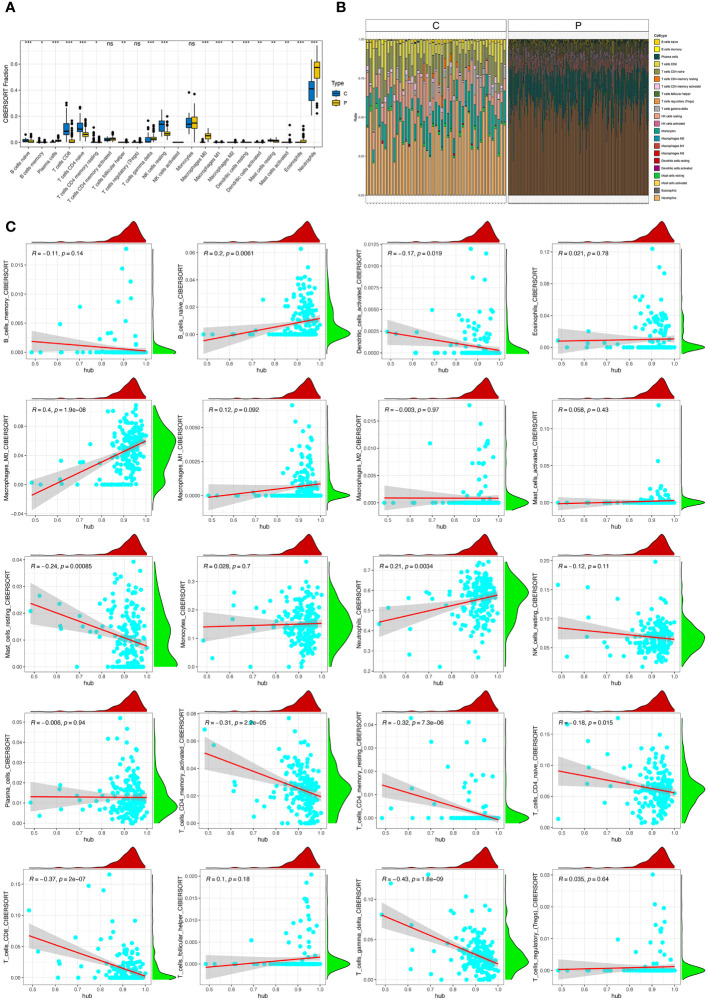
Figure 5.
Immune infiltration in sepsis. (A) Panel representative boxplot shows the differences of infiltrated immune cells between sepsis samples (P type) and control samples (C type). (B) The relative proportions of 22 immune cell types between sepsis samples (P type) and control samples (C type). (C) Correlations between hub genes and immune cells. *, P<0.05; **, P<0.01; ***, P<0.001; ns, P>0.05.

