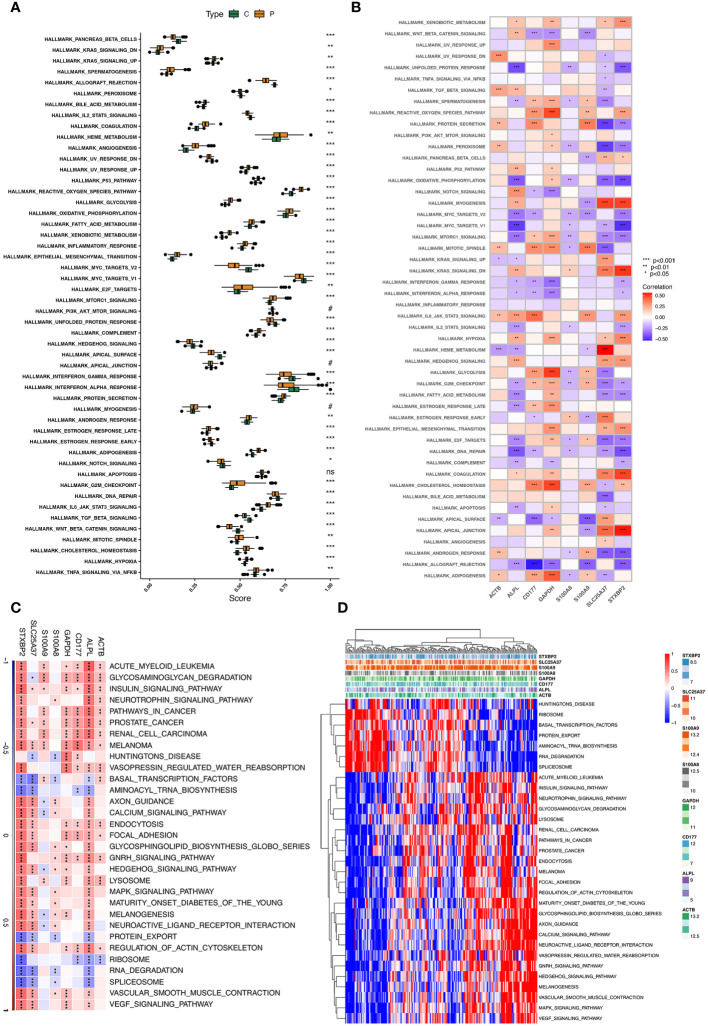
Figure 6.
ssGSEA and GSVA of eight hub genes. (A) The specific distribution of the 50 hallmark gene sets in sepsis samples (P type) and control samples (C type). (B) Correlation analysis of the 50 hallmark gene sets with eight hub genes. (C, D) Heatmap showing the enriched pathways of eight hub genes in neutrophil clusters using GSVA.

