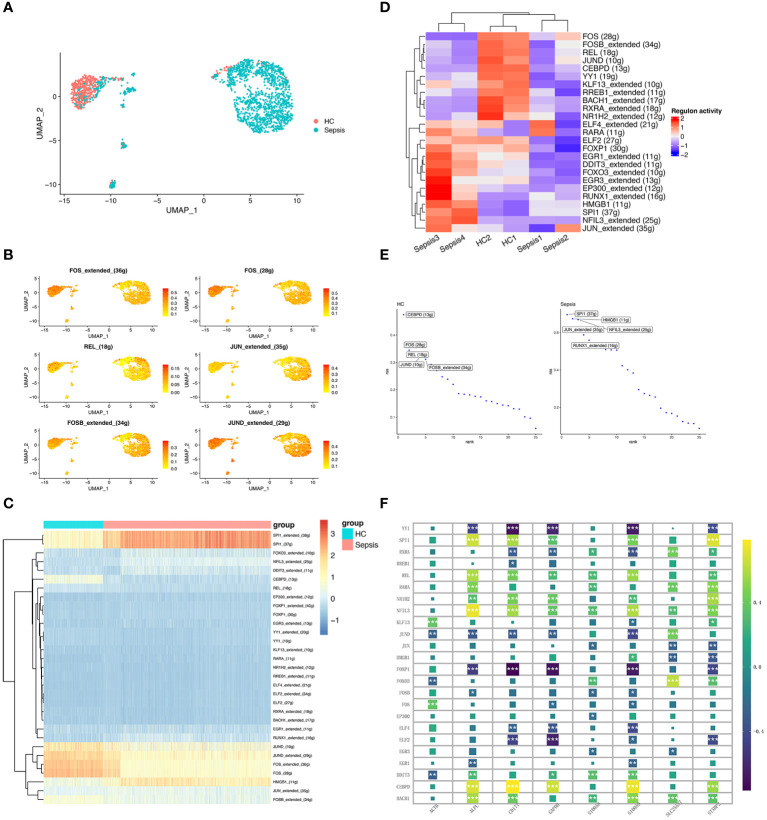
Figure 7.
Transcriptional regulatory network of neutrophils. (A) UMAP plot depicts the distribution of neutrophils in the sepsis and healthy control groups. (B) Activity distribution of FOS, REL, JUN, FOSB, and JUND. (C) Heatmap shows the differences of TFs in neutrophils between the sepsis and healthy control groups. (D) Heatmap of the top 25 regulators with the highest area under curve (AUC) scores showing the activity of TFs in neutrophils clusters using SCENIC. (E) Top activities of TFs between different groups. RSS indicates Regulon Specificity Score. (F) Correlation between eight hub genes (ALPL, ACTB, CD177, GAPDH, SLC25A37, S100A8, S100A9, and STXBP2) expression and the level of 24 inferred TFs. *, P<0.05; **, P<0.01; ***, P<0.001.

