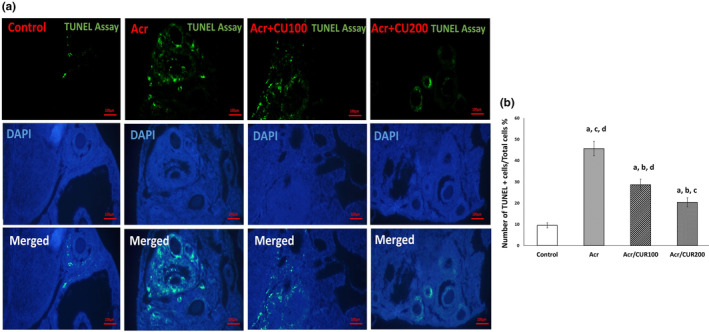
FIGURE 7.

(a) Representative pictures of immunofluorescence staining for TUNEL (green fluorescence) in ovarian sections of mice, counterstained with DAPI for nuclei (blue), and merged pictures, in control, acrylamide (Acr), Acrylamid+curcumin100 (Acr/CUR100), and Acrylamid+curcumin200 (Acr/CUR200) groups. (b) Quantification of Immunofluorescence staining for SOD, CAT, and GPX protein expression. Data expressed as means ± SD. Data are statistically significant at p < .05. a: vs. Control group. b: vs. Acr group. c: vs. Acr/CUR100 group. d: vs. Acr/CUR200 group.
