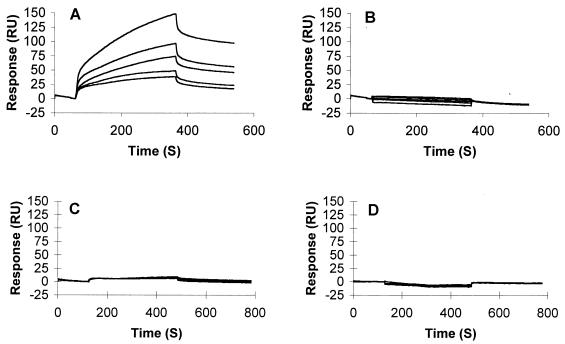
FIG. 7.
SPR analysis of R5X4- and R5-derived gp120–heparin interactions: overlay of sensorgrams showing binding of gp120 to immobilized heparin. (A and B) Binding curves for R5X4 gp12089.6 (A) and R5X4 gp120W61D (B) injected at (from top to bottom) 60, 45, 30, 22.5, and 15 nM. (C and D) Binding curves for wild-type R5 gp120JRFL (C) and V3 loop-deleted gp120JRFL (D) injected at (from top to bottom) 90, 60, 45, and 30 nM over the heparin surface. Binding conditions were similar to those described in the legend to Fig. 6. S, seconds.

