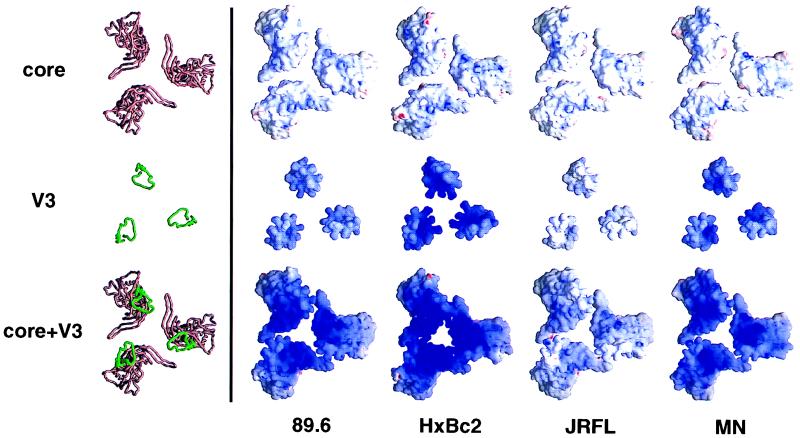
FIG. 8.
Modeling of the electrostatic potential for the coreceptor binding surface of the gp120 trimer. The molecular models of the gp120 trimer shown here are orientated with the trimer axis perpendicular to the page, showing the conserved surfaces of the HIV-1 clones HXBc2, MN, 89.6, and JRFL. The top panels show the gp120 core, the middle panels show the V3 loop, and the bottom panels show the V3 loop integrated into the gp120 core. These models are depicted in a Cα worm representation (left column) and an electrostatic surface representation (other four columns). The Cα worm representations for the different strains are essentially indistinguishable: the one corresponding to the HXBc2 sequence is shown with the core colored rust brown and the V3 loop colored green. The electrostatic potentials were calculated with the program Delphi and are depicted at the solvent-accessible surface, which is colored according to the local electrostatic potential, ranging from dark blue (most positive, corresponding to 10 kT/e) to red (most negative). The figure was prepared with the program GRASP (56).

