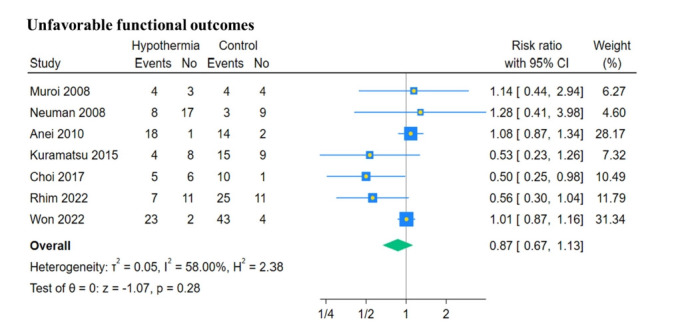
Figure 2.

Forest plot of studies comparing unfavorable functional outcomes in the therapeutic hypothermia group with that in the control group. The horizontal bars represent 95% confidence intervals (CIs).

Forest plot of studies comparing unfavorable functional outcomes in the therapeutic hypothermia group with that in the control group. The horizontal bars represent 95% confidence intervals (CIs).