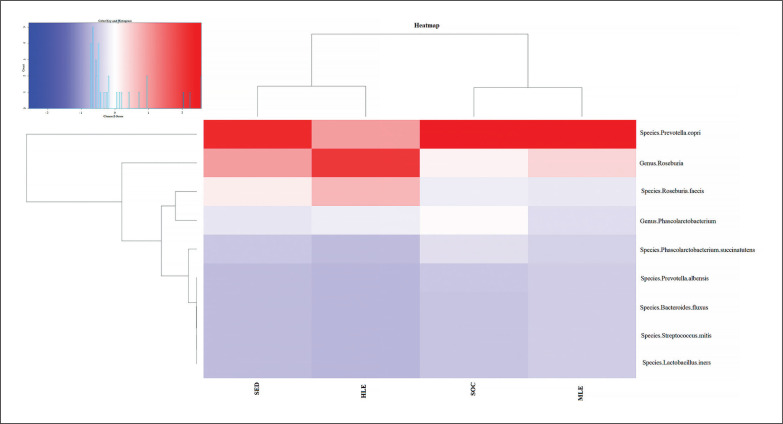
FIG. 4.
Distribution of bacterial species in the heatmap. The heatmap (constructed with R studio’s heatmap.2 function) depicts the distribution of the various bacterial species with different colors ranging from red to blue through intermediate colors. The red color represents a higher z score (>1.5), while the blue color represents a lower z score (<0.2).

