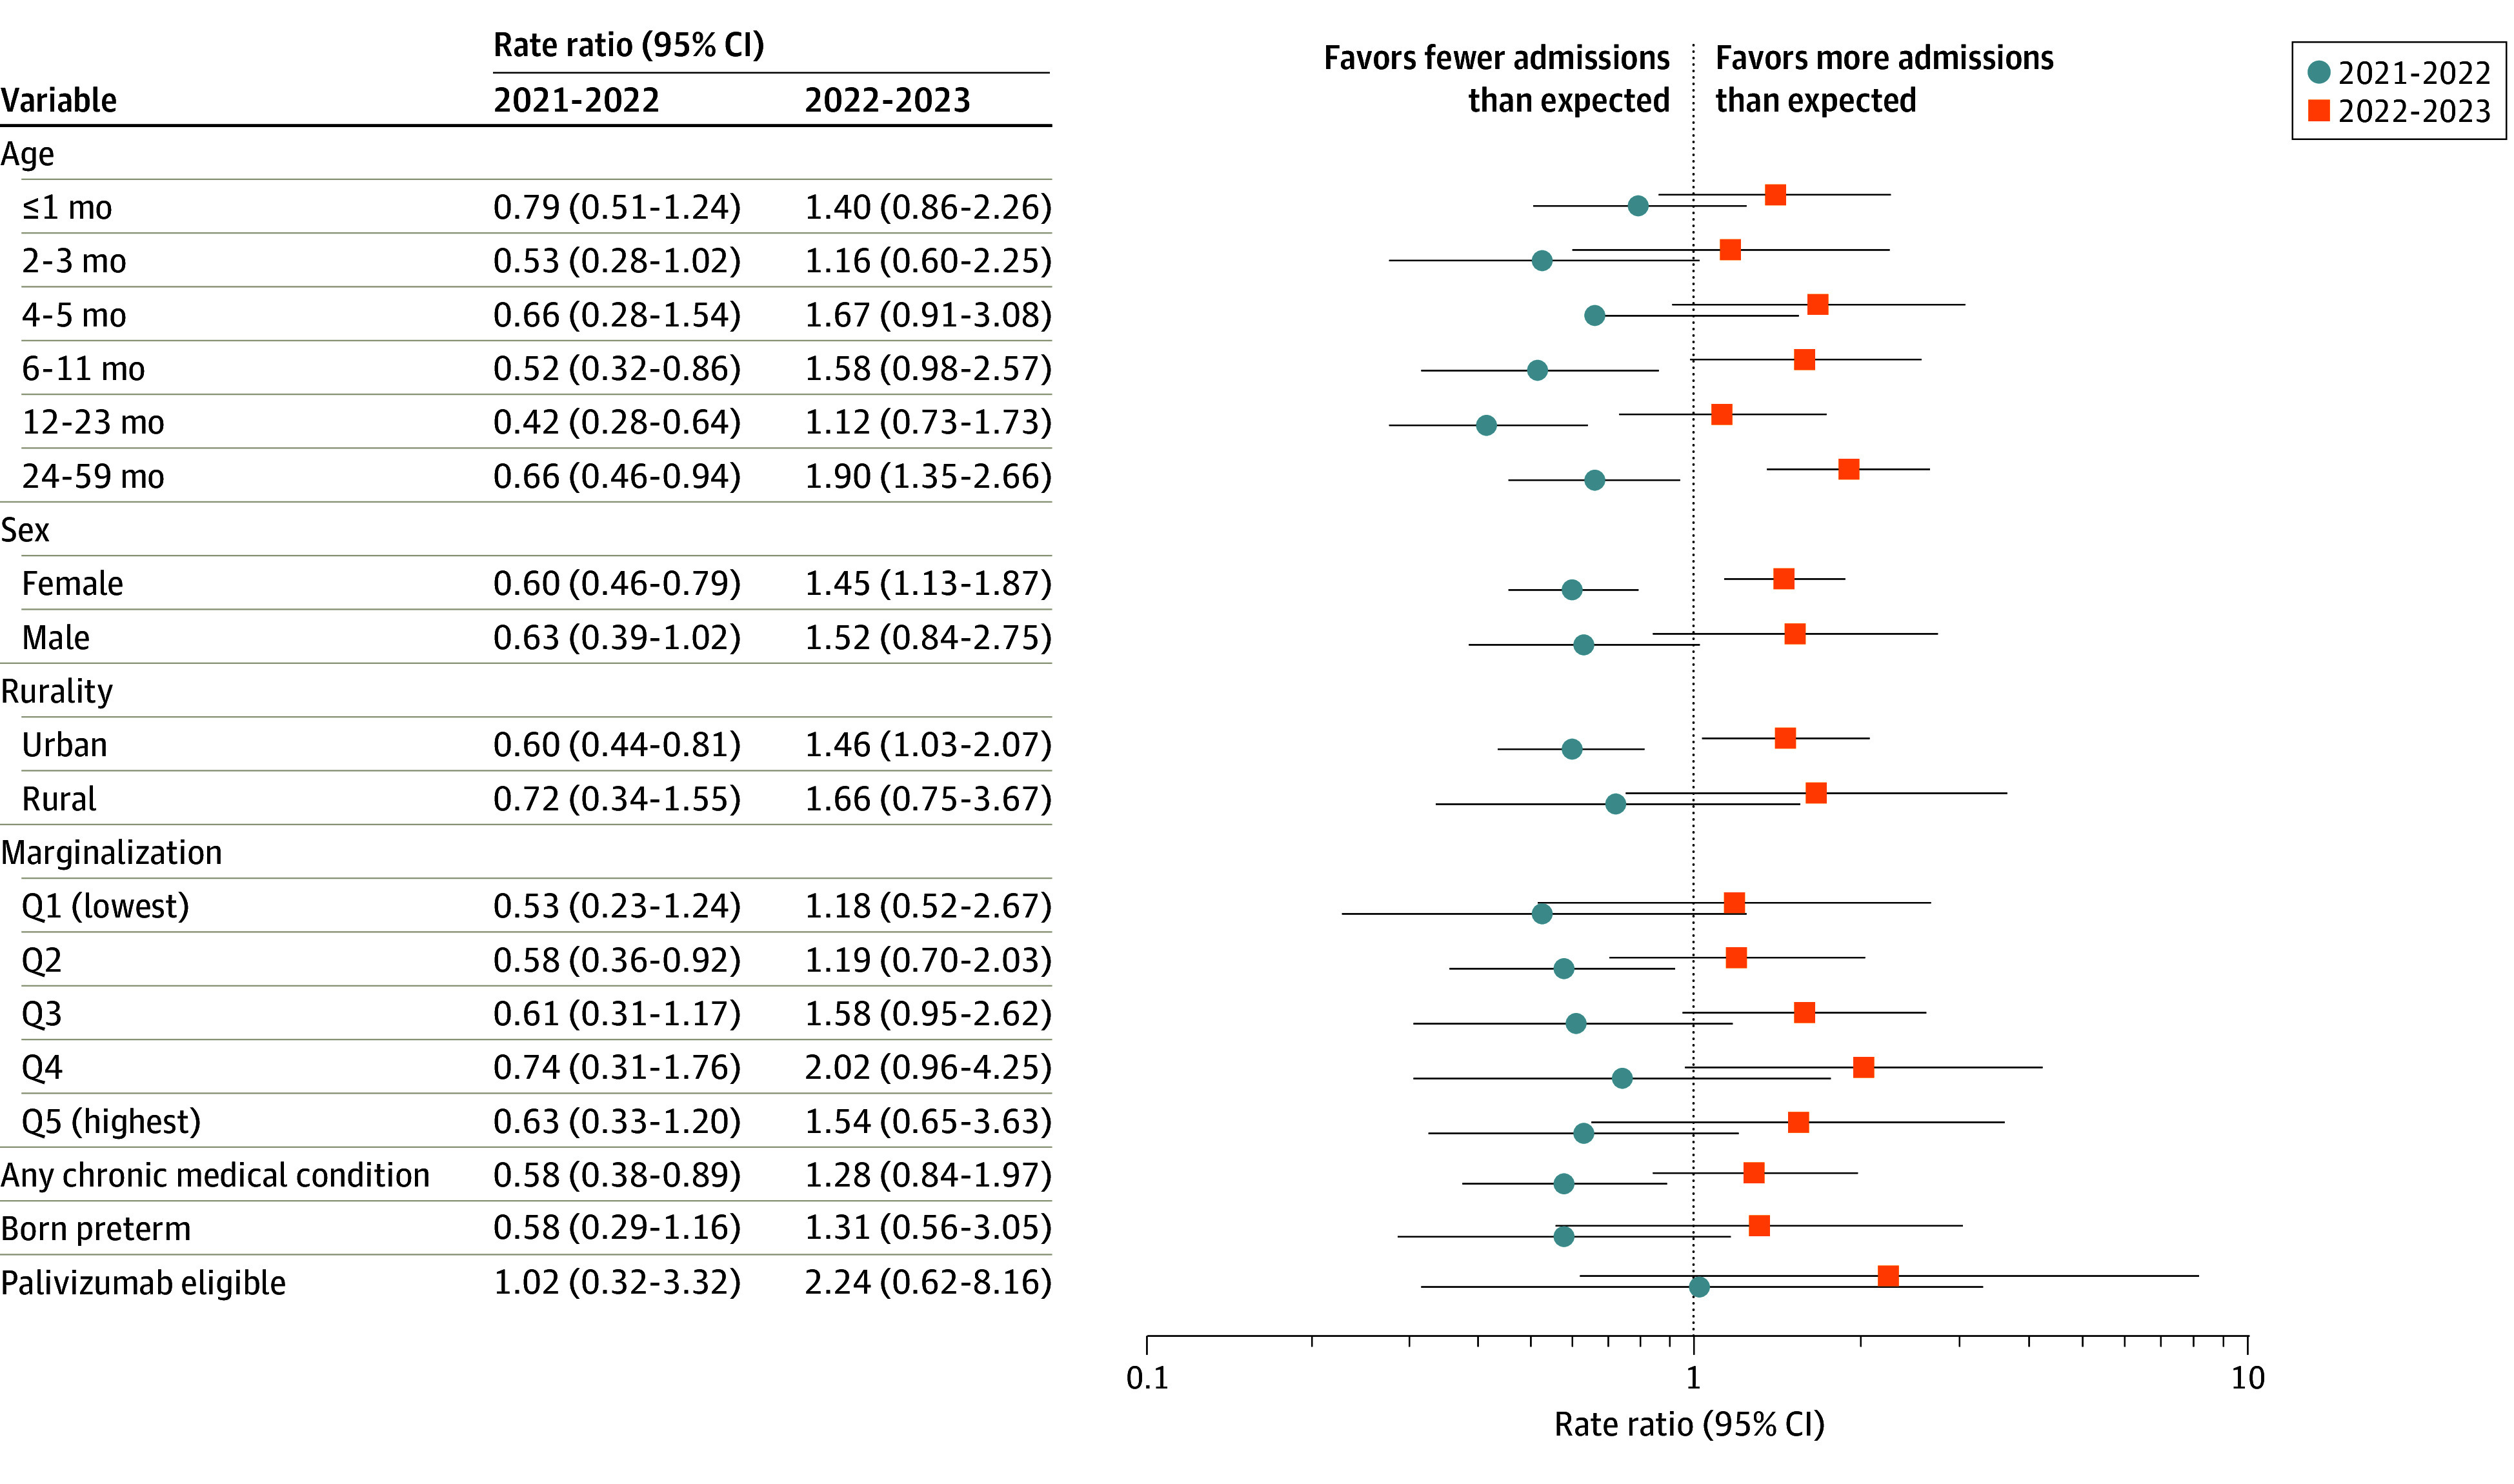
Figure 3. Adjusted Rate Ratio of Observed vs Expected Respiratory Syncytial Virus–Associated Hospitalizations According to Sociodemographic and Medical Characteristics.

Hospitalizations during the 2021-2022 and 2022-2023 vs the 2017-2019 and 2019-2020 seasons. Q indicates quintile.
