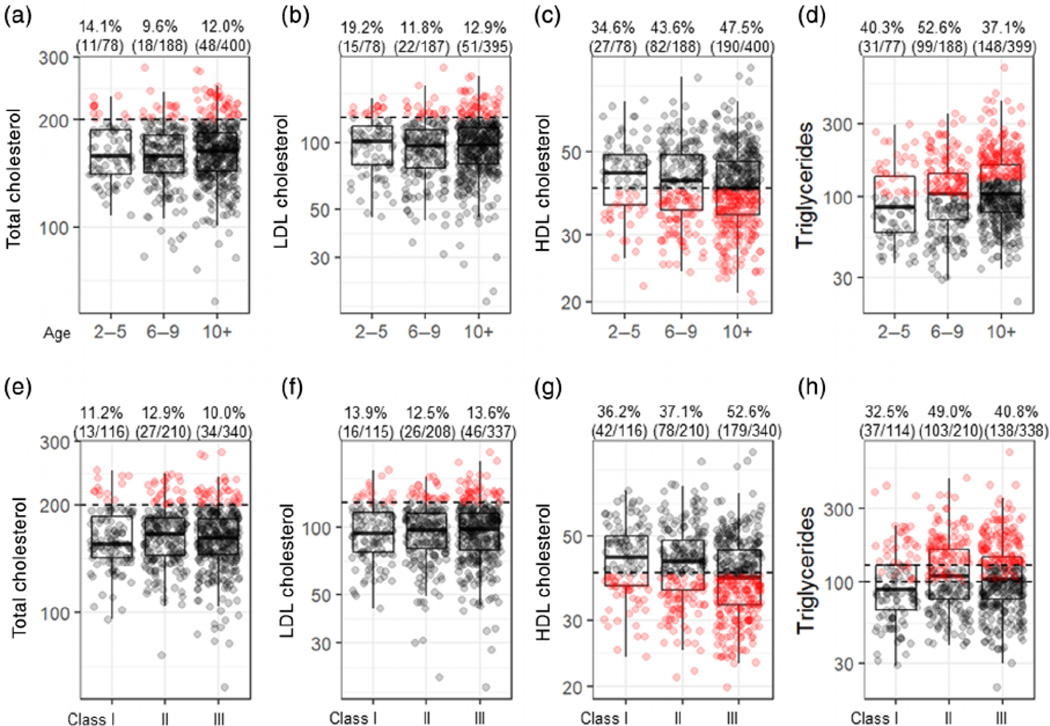
FIGURE 2.
Lipid parameters stratified by age versus obesity class. Total cholesterol (A), LDL cholesterol (B), HDL cholesterol (C), and triglycerides (D) as stratified by age group. Total cholesterol (E), LDL cholesterol (F), HDL cholesterol (G) and triglycerides (H) as stratified by obesity class. The black dashed lines represent the age-specific upper normal for individual lipid parameters. The dark lines inside of the box plots represent the age group-/obesity class-specific median values. The upper and lower parts of the boxes represent the 75th and 25th percentiles, respectively. The whiskers represent either 1.5-times the interquartile range (75th percentile minus the 25th percentile) from the 25th/75th percentiles or the maximum/minimum values, whichever is smaller. The red dots indicate the subjects with abnormal and the grey dots indicate those with normal lipid parameters. The percentages represent the frequency of children with abnormal lipids in that group. The numbers list the subjects with abnormal lipids and the total number of subjects in that group

