
Figure 2.
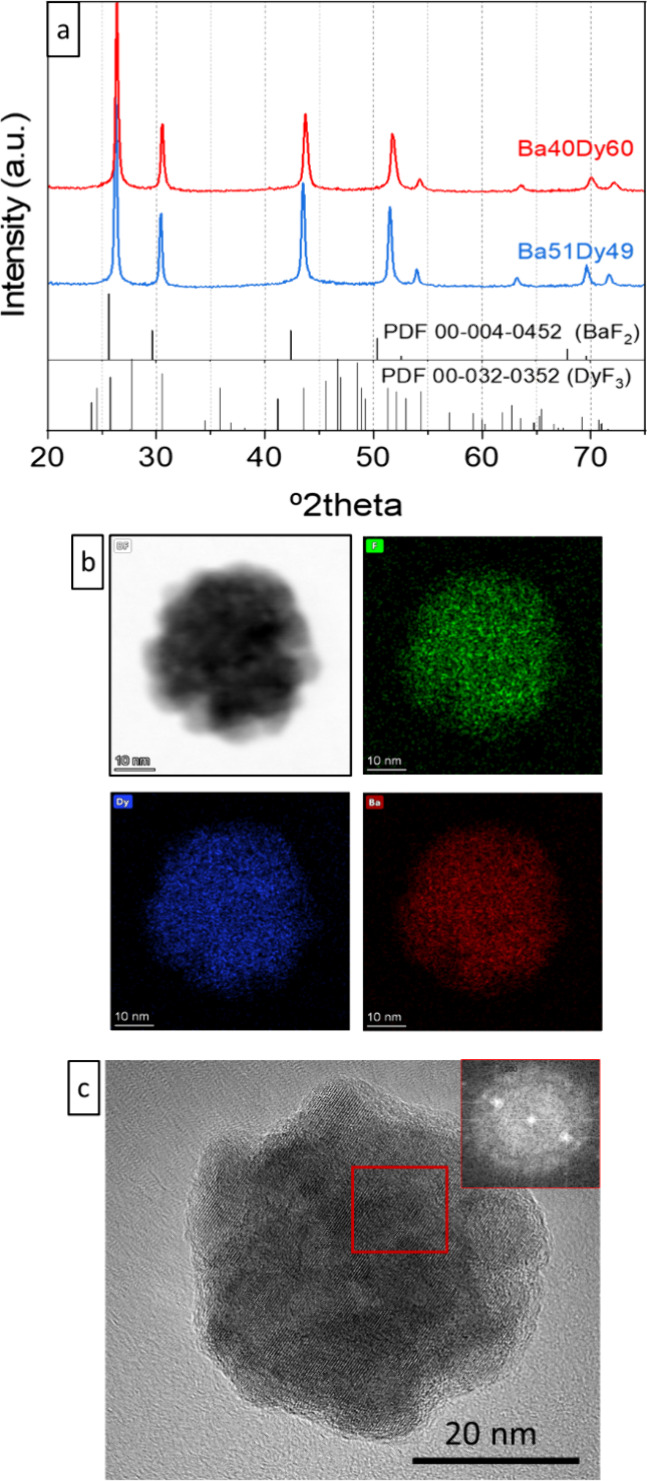
(a) XRD patterns of Ba40Dy60 and Ba51Dy49 samples. Powder diffraction files of cubic BaF2 and orthorhombic DyF3 are shown at the bottom. (b, c) EDX mappings and HRTEM image of a single Ba51Dy49 NP.
Official websites use .gov
A
.gov website belongs to an official
government organization in the United States.
Secure .gov websites use HTTPS
A lock (
) or https:// means you've safely
connected to the .gov website. Share sensitive
information only on official, secure websites.
(a) XRD patterns of Ba40Dy60 and Ba51Dy49 samples. Powder diffraction files of cubic BaF2 and orthorhombic DyF3 are shown at the bottom. (b, c) EDX mappings and HRTEM image of a single Ba51Dy49 NP.