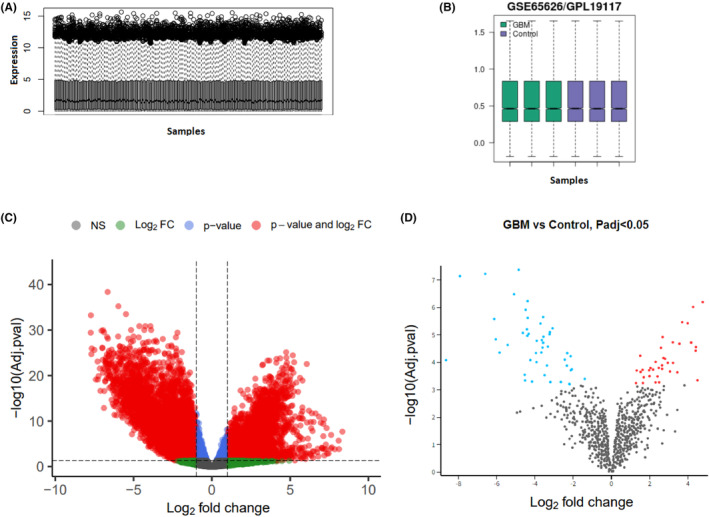
FIGURE 2.

Data quality assessment and identification of differentially expressed genes (DEG). (A) Boxplot of intensity distributions in the normalized RNAseq data. The relative lncRNA and mRNA expression values are comparable among all 174 samples after normalization. (B) Boxplot for the normalized microarray data of microRNA expression profiles. Each box represents a sample. (C) Volcano plot of DElncRNAs and DEmRNAs, (D) Volcano plot of DEmiRNA in Glioblastoma Multiforme.
