FIGURE 3.

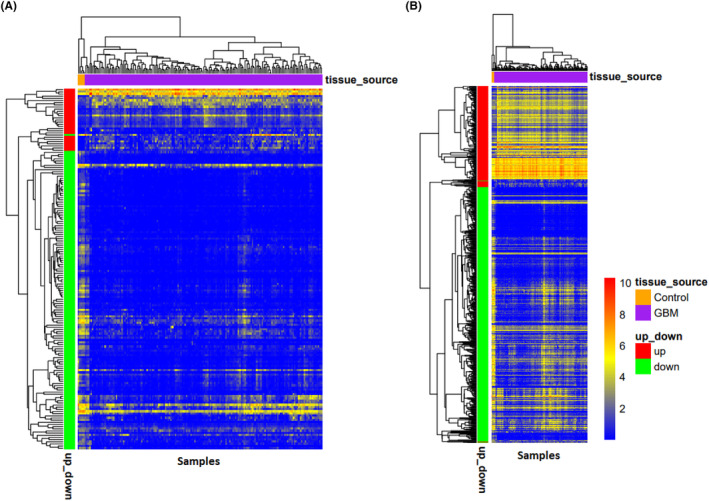
Heatmap of differentially expressed lncRNAs (A) and mRNAs (B) in Glioblastoma Multiforme that were correlated. The horizontal axis shows the names of 174 samples. The vertical axis presents the gene names.

Heatmap of differentially expressed lncRNAs (A) and mRNAs (B) in Glioblastoma Multiforme that were correlated. The horizontal axis shows the names of 174 samples. The vertical axis presents the gene names.