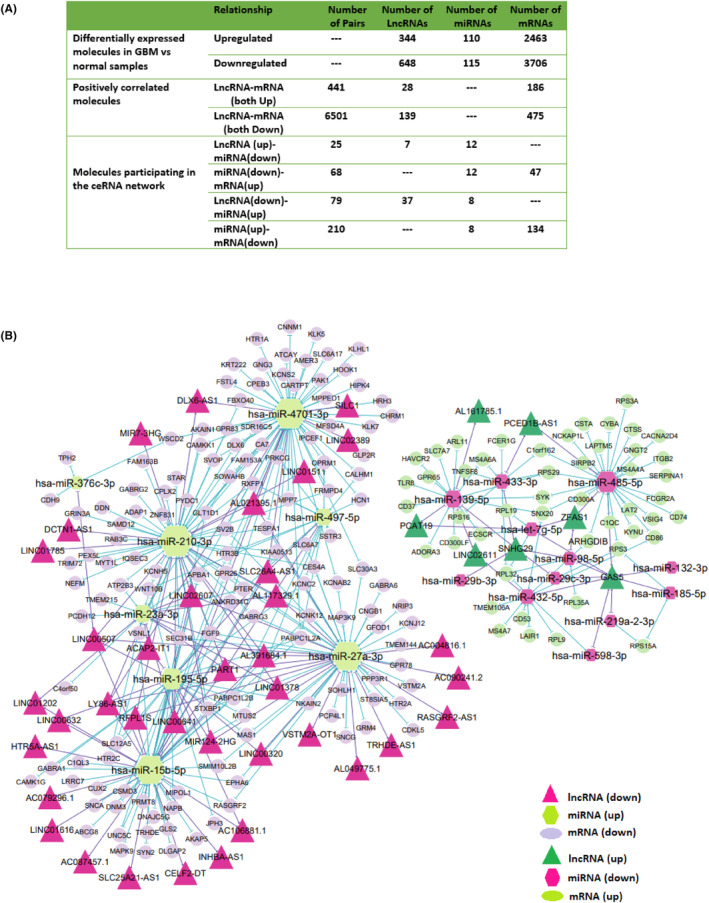
FIGURE 4.

The lncRNA‐associated ceRNA network. (A) The number of relationships and pairs among lncRNAs, miRNAs, and mRNAs in the ceRNA network and the number of differentially expressed molecules and correlated molecules. (B)The ceRNA network was constructed based on identified lncRNA–miRNA and miRNA–mRNA interactions. The networks include down/upregulated lncRNAs, up/downregulated miRNAs, and lower/overexpressed mRNAs in Glioblastoma Multiforme. All node sizes were represented by degree.
