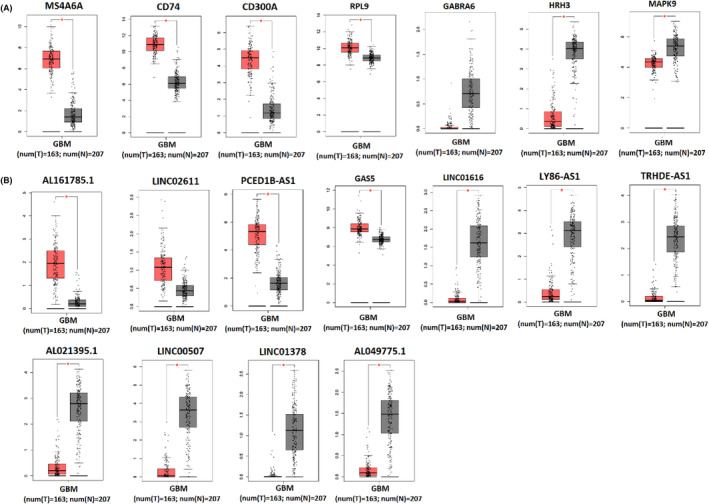
FIGURE 9.

Validation of expression changes of seed nodes and their related lncRNAs in GBM tissue. (A) It represents up/downregulated mRNAs in biopsies of patients with GBM (T) (red box) compared to normal tissue (N) (grey box), including MS4A6A, CD74, CD300A, RPL9, GABRA6, HRH3, and MAPK9. (B) It shows up/downregulated lncRNAs in biopsies of patients with GBM (T) (red box) compared with normal tissue (N) (grey box), including AL161785.1, LINC02611, PCED1B‐AS1, GAS5, LINC01616, LY86‐AS1, TRHDE‐AS1, AL021395.1, LINC00507, LINC01378, AL049775.1. Data were obtained from the TCGA and GTEx datasets. *p < 0.01. Expression was log2 transformed (TPM + 1).
