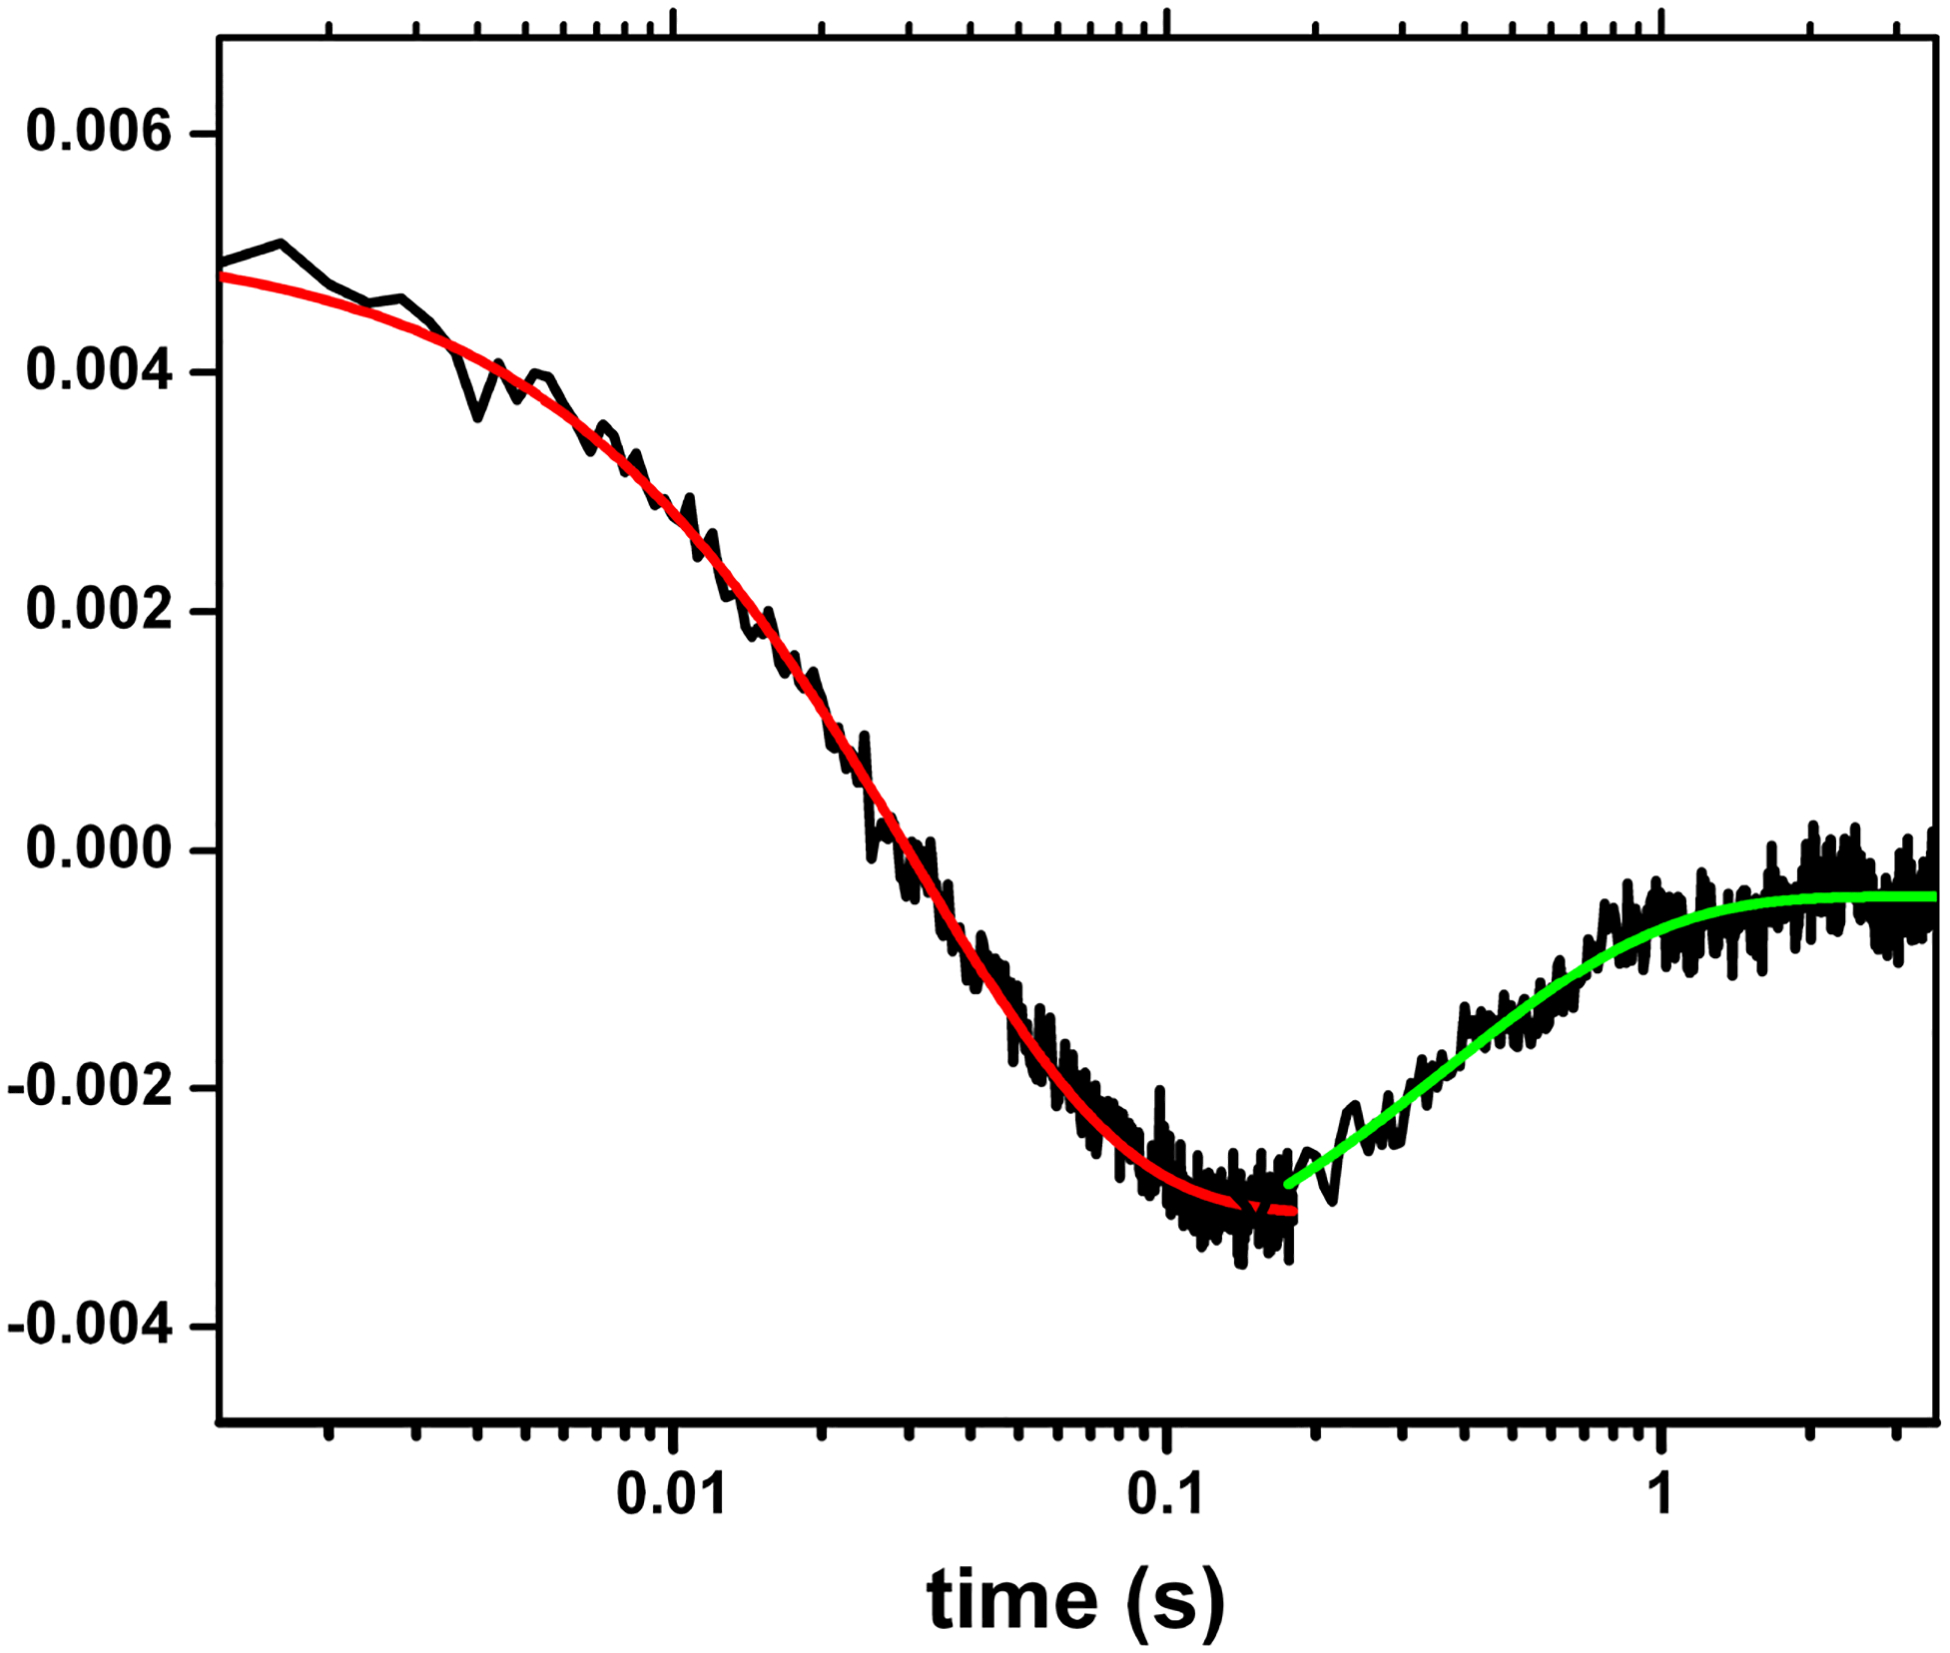
Figure 4.

Transient traces at 460 nm at 0 – 4 s obtained for the (Fe(II)-CO)(FMNH·) form of nNOSm holoenzyme flashed by 450 nm laser. The graph is a combined plot of two individual traces at 0 – 0.2. s and 0 – 4 s using a logarithmic timescale; solid lines correspond to the best single-exponential fit to the data in different parts: the red and green lines are of the FMN-heme IET and the CO re-binding processes, respectively. This is to show the spectral “transition”, i.e., a reversal in direction of absorption changes over time in the traces. Such transition feature indicates successful observation of the FMN-heme IET, and can only be detected at 580–600 nm (that is due to FMNH· reduction), and 465 or 460 nm (that is due to heme re-oxidation in iNOS and nNOS respectively), if the IET takes place. Sample temperature was set at 21 °C. Anaerobic solution contained ~ 10 mM NOS protein, ~ 20 mM dRF and 5 mM fresh semicarbazide in pH 7.6. buffer (40 mM Bis-Tris propane, 400 mM NaCl, 2 mM l-Arg, 20 mM H4B, 1 mM Ca2+ 4 and 10 % glycerol).
