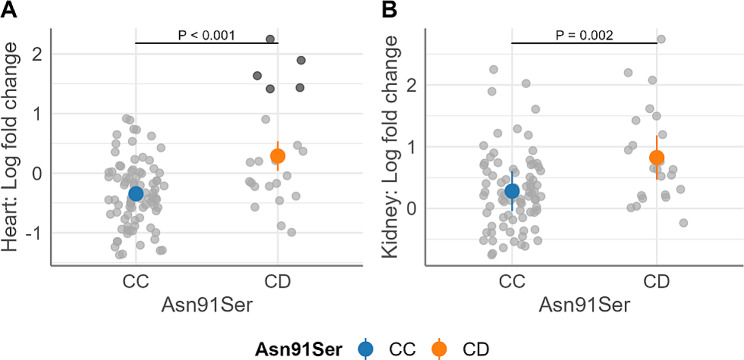
Fig. 2.
Estimated marginal means (EMM) of natural log transformed fold change (FC) of fetal DIO2 expression. (A) fetal heart; (B) fetal kidney. Data is grouped by Asn91Ser genotype for the subset of the trial-2 [14]. Fold change was calculated relative to control fetuses from non-inoculated litters and transformed by natural logarithm. Colored dots and associated vertical lines are EMM and 95% confidence interval, respectively. Overlapping gray dots are observed values. 5 CD fetuses deviating over log FC > 1 are highlighted with the dark gray dots in (A). P values for coefficient of genotype are labeled in the plots. Fetal counts in each genotype: (A) CC = 87, CD = 23; (B) CC = 81, CD = 23. Ratio of brain to liver weight (P = 0.001) or brain weight (g) (P = 0.015) included as a covariate in the regression model for heart log FC or kidney log FC, respectively

